linkedin

Koyfin VS TradingView

Let’s have a side-by-side comparison of Koyfin vs TradingView to find out which one is better. This software comparison between Koyfin and TradingView is based on genuine user reviews. Compare software prices, features, support, ease of use, and user reviews to make the best choice between these, and decide whether Koyfin or TradingView fits your business.

Quick View

  • Rating & Review
  • Platforms
  • Recommended
  • img 1 Ratings & 1 Reviews
  • icon_ubuntu icon_desktop icon_ios icon_Android icon_mac icon_linux
  • img 19 Ratings & 19 Reviews
  • icon_ubuntu icon_desktop icon_ios icon_Android icon_mac icon_linux

Key Differences Between Koyfin and TradingView for Market Data & Charting

  • Primary Focus and Use Cases: Koyfin is built as a financial analytics and market-data platform focused on fundamentals, financial statements, macro data, institutional-grade charting, and data for investors interested in company metrics and macroeconomic analysis. TradingView is focused on technical analysis, charting, real-time price data, community-driven ideas, and interactive tools for traders and retail investors.
  • User Experience and Learning Curve: Koyfin provides dashboards, data-driven charts, and company/sector comparison tools suited for fundamental or value-based analysis, which may require some familiarity with financial metrics. TradingView offers a flexible charting interface with drawing tools, indicators, and scripting support, which is intuitive for traders familiar with technical analysis.\li>
  • Features and Functionality: Koyfin supports financial data visualization, ratio and financial-statement analysis, macroeconomic charts, company/sector dashboards, and tools for stock screening based on fundamental or macro criteria. TradingView provides price charts, technical indicators, custom scripts, alerts, drawing tools, and supports a broad range of assets (stocks, forex, crypto, futures, etc.) with strong user-community support for shared ideas and chart templates.
  • Data Breadth and Depth: Koyfin emphasizes depth in fundamentals, financial statements, macro data, and long-term historical data across companies and markets — making it valuable for deep research and investment analysis. TradingView emphasizes real-time data, price action, chart responsiveness, and short-term to medium-term trading signals rather than deep fundamental data analysis.
  • Customization and Flexibility: Koyfin allows users to build custom dashboards, compare companies or sectors, filter by financial metrics, and run screener-based analysis for investment research. TradingView enables extensive customization of charts, custom technical indicators, strategy scripting, alert setup, and cross-asset charting flexibility, providing flexibility for active traders and chart analysts.
  • Ideal Audience and Application: Koyfin is ideal for investors, analysts, and portfolio managers focused on fundamentals, company valuations, macro trends, and long-term investment research. TradingView is best suited for traders, technical analysts, and retail investors looking for real-time charts, technical indicators, strategy testing, and community-driven trading ideas.

Pricing

img

Price Plans

$ 49.00

Plus

$ 110.00

Pro

$ 349.00

Advisor Pro

View Details img

$ 14.95

Essential

$ 33.95

Plus

$ 67.95

Premium

View Details img

  • Free Trial
  • Lifetime Plan
  • img Free Trial
  • img
  • img

Ratings

img

Overall ratings

4.7

1 Ratings & 1 Reviews

90% Likelihood to Recommend

4.5

19 Ratings & 19 Reviews

91% Likelihood to Recommend

Pros & Cons

img

Pros

Not Available

Currently no pros are available. Please check back later

img

The product is quite easy to use. Overall, the product functions effectively. A ...Read more - MOHIT GAJERA Feb 07, 2025

img

The software is user-friendly, even for beginners. It helps in thoroughly analyz...Read more - neeeraj singh Feb 05, 2025

Cons

Not Available

Currently no cons are available. Please check back later

img

The customer service is not satisfactory. It is a complete dissatisfaction. - MOHIT GAJERA Feb 07, 2025

img

There are no disadvantages. - neeeraj singh Feb 05, 2025

Reviews

img

Verified customer reviews

Not Available

Currently no reviews are available. Please check back later

Overall Good Product but Lacks Customer Service

MOHIT GAJERA Feb 07, 2025

Innovative and Easy to Use Technical Analysis Software

neeeraj singh Feb 05, 2025

Best Use for

img

Business Size:

  • img Individual
  • img 2-50 Employees
  • img 51-250 Employees
  • img 250-500 Employees
  • img 500-1000 Employees
  • img More than 1000+ Employees
  • img Individual
  • img 2-50 Employees
  • img 51-250 Employees
  • img 250-500 Employees
  • img 500-1000 Employees
  • img More than 1000+ Employees

Business Type:

  • img Small Business
  • img Startups
  • img Medium Business
  • img Enterprise
  • img SMBs
  • img SMEs
  • img MSMBs
  • img MSMEs
  • img Freelancers
  • img Individual
  • img Small Business
  • img Startups
  • img Medium Business
  • img Enterprise
  • img SMBs
  • img SMEs
  • img MSMBs
  • img MSMEs
  • img Freelancers
  • img Individual

Industries:

  • imgStock Market
  • imgAll Industries

Koyfin vs TradingView: Comparision Video

img
img
img
img

Features

img

Core Features

  • img Portfolio Management
  • img Market Data
  • img Watchlist
  • img Charting Tools
  • img Order Control
  • img Order Execution
  • img Stock Screener
  • img Portfolio Management
  • img Market Data
  • img Watchlist
  • img Charting Tools
  • img Order Control
  • img Order Execution
  • img Stock Screener

Order Execution

  • img Limit Order
  • img Market Order
  • img Stop (Loss) Order
  • img Stop Limit Orders
  • img Trailing Stop Order
  • img Limit Order
  • img Market Order
  • img Stop (Loss) Order
  • img Stop Limit Orders
  • img Trailing Stop Order

Research and Analysis

  • img Sentiment Analysis
  • img Advanced Order Flow Analysis
  • img Analyst Ratings
  • img Multi-Timeframe Analysis
  • img Sentiment Analysis
  • img Advanced Order Flow Analysis
  • img Analyst Ratings
  • img Multi-Timeframe Analysis

Technical Analysis

  • img Smart drawing tools
  • img Trendlines
  • img Technical Indicators
  • img Custom Indicators
  • img Automated Technical Patterns Detection
  • img Smart drawing tools
  • img Trendlines
  • img Technical Indicators
  • img Custom Indicators
  • img Automated Technical Patterns Detection

Fundamental Analysis

  • img Balance Sheet
  • img Income Statement
  • img Industry Analysis
  • img Financial Ratios
  • img Cash Flow Statements
  • img Earnings Forecasts
  • img Company Valuation Models
  • img Balance Sheet
  • img Income Statement
  • img Industry Analysis
  • img Financial Ratios
  • img Cash Flow Statements
  • img Earnings Forecasts
  • img Company Valuation Models

Backtesting and Optimization

  • img Paper Trading
  • img Historical Data Simulation
  • img Strategy Tester
  • img Strategy Optimization
  • img Monte Carlo Simulation
  • img Paper Trading
  • img Historical Data Simulation
  • img Strategy Tester
  • img Strategy Optimization
  • img Monte Carlo Simulation

Risk Management

  • img Performance Analytics
  • img Risk Calculator
  • img Position Sizing Calculator
  • img Diversification Analysis
  • img Stop-Loss Automation
  • img Maximum Drawdown Analysis
  • img Performance Analytics
  • img Risk Calculator
  • img Position Sizing Calculator
  • img Diversification Analysis
  • img Stop-Loss Automation
  • img Maximum Drawdown Analysis

Trading Options

  • img Paper Trading
  • img Swing Trading
  • img Intraday Trading
  • img Derivative Trading
  • img Algorithm Trading
  • img Options Trading
  • img Futures Trading
  • img Forex Trading
  • img Crypto Trading
  • img Automatic Trading
  • img Rotational Trading
  • img Spread Trading
  • img Paper Trading
  • img Swing Trading
  • img Intraday Trading
  • img Derivative Trading
  • img Algorithm Trading
  • img Options Trading
  • img Futures Trading
  • img Forex Trading
  • img Crypto Trading
  • img Automatic Trading
  • img Rotational Trading
  • img Spread Trading

Reporting & Analytics

  • img Dashboards
  • img Portfolio Tracking
  • img Customizable Reports
  • img Risk Analytics
  • img Trade Performance Attribution
  • img Dashboards
  • img Portfolio Tracking
  • img Customizable Reports
  • img Risk Analytics
  • img Trade Performance Attribution

Account Management

  • img Audit Trail
  • img Multi-Factor Authentication (MFA)
  • img User Access Management
  • img Customizable User Interface
  • img Account Summary Reports
  • img Audit Trail
  • img Multi-Factor Authentication (MFA)
  • img User Access Management
  • img Customizable User Interface
  • img Account Summary Reports

Integrations

  • img Social Media Integration
  • img API Integration
  • img Multi-Language Support
  • img Third Party Integration
  • img Market Data Integration
  • img Brokerage Integration
  • img Cloud Data Integration
  • img Social Media Integration
  • img API Integration
  • img Multi-Language Support
  • img Third Party Integration
  • img Market Data Integration
  • img Brokerage Integration
  • img Cloud Data Integration

Alerts & Notifications

  • img Price Alert
  • img Push Notifications
  • img Volume Alerts
  • img Real-Time Market Updates
  • img News Alert
  • img Sentiment Alerts
  • img Price Alert
  • img Push Notifications
  • img Volume Alerts
  • img Real-Time Market Updates
  • img News Alert
  • img Sentiment Alerts

Specifications

img

Deployment

  • img Web based
  • img On Premises
  • img Web based
  • img On Premises

Device Supported

  • img Desktop
  • img Mobile
  • img iPad
  • img Tablet
  • img Desktop
  • img Mobile
  • img iPad
  • img Tablet

Supported Platforms

  • img Windows
  • img Mac OS
  • img Android
  • img iOS
  • img Linux
  • img Ubuntu
  • img Windows
  • img Mac OS
  • img Android
  • img iOS
  • img Linux
  • img Ubuntu

Languages support

  • imgEnglish
  • imgEnglish

Compliance Regulations:

  • img COPPA
  • img HIPAA
  • img CCPA
  • img CPRA
  • img ECPA
  • img COPPA
  • img HIPAA
  • img CCPA
  • img CPRA
  • img ECPA

Alternatives

img

Top Alternative Products

MultiCharts

MultiCharts


TrendSpider

TrendSpider


ProRealTime

ProRealTime


GoCharting

GoCharting


See all Koyfin alternatives img
MultiCharts

MultiCharts


TrendSpider

TrendSpider


ProRealTime

ProRealTime


GoCharting

GoCharting


See all TradingView alternatives img

Send this comparison to my inbox

img Get directly in your email inbox on your Whatsapp

Similar Comparison

Koyfin vs TradingView Comparison FAQs

Software questions,
answered

Koyfin focuses on financial data analytics and macro research, while TradingView specializes in live technical charting and community trading tools.

Koyfin is better for investors and analysts, while TradingView is ideal for traders who rely on technical indicators and live market data.

Both offer free plans with limited features. Koyfin’s paid plans start affordably, while TradingView offers Pro, Pro+, and Premium tiers depending on charting and data needs.

Yes. Many professionals use Koyfin for research and fundamental data, while using TradingView for execution and technical analysis.

Both serve the financial analysis space but cater to different audiences. Koyfin for long-term researchh and TradingView for active trading.

A Quick Comparison Between Koyfin vs TradingView

Choosing any software for your organisation is a crucial decision. As a decision maker, you must ensure that the software you choose addresses the pain points of your teams and reaps maximum benefit for you.

  • Koyfin vs TradingView: Which Stock Market Software is Right for You?
  • Koyfin and TradingView: Comparison Table
  • Detailed Feature Comparison of Koyfin and TradingView
  • When to Choose Koyfin or TradingView?
  • Final Verdict: Koyfin or TradingView?

Koyfin vs TradingView: Which Stock Market Software is Right for You?

Koyfin provides a high level of customer service, investment value, and data management service for novice investors. It is a value-added set of institutional-grade investment data analytics for value-driven, data and investment-management-oriented consumers. It adds value for data screeners, macro dashboard analytics, and investment management charts for equities, ETFs, and diverse global markets for value-driven consumers from a single data service terminal with integrated dashboard analytics.

TradingView, by contrast, is data screeners plus social-driven analytics. It is a value-added data service for live metrics and social analytics data. It is designed for users who value the instant metrics and social data from analytics discussions for thematic charts and complex trading algorithms.

In conclusion, for financial analytics and data visualization, investors will appreciate the service best suited to their time spent in active investment management. Dynamic data management and algorithms that are active in real time will best serve instant, metric-oriented clients.

Koyfin and TradingView: Comparison Table

Feature Koyfin TradingView
Primary Use Case Financial data analytics and visualization Technical charting and real-time trading analysis
Target Audience Investors, analysts, and portfolio managers Traders, technical analysts, and charting enthusiasts
Core Functionality Stock screeners, dashboards, macro data Interactive charts, indicators, and alerts
Customization Custom dashboards, data filters, and metrics Custom chart layouts, scripts, and community indicators
Pricing Freemium with paid plans Freemium with Pro, Pro+, and Premium tiers
Integration & API Data exports, Excel, and portfolio tracking Broker integrations and Pine Script automation
Ideal For Research-focused investors and analysts Active traders and technical analysts

Detailed Feature Comparison of Koyfin and TradingView

  • Market Data & Analysis

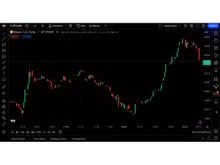
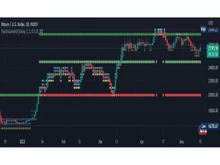
Koyfin integrates macro-economic and global political data with real macroeconomic time metrics. It pulls in data for financial records, charts, and investors for driven decisions from global data to personalized dashboards. TradingView offers live market data across multiple asset classes, stocks, forex, crypto, and futures, with interactive charts and indicators tailored for real-time decision-making.

  • Charting & Visualization

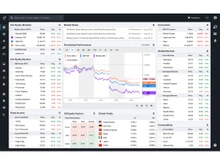
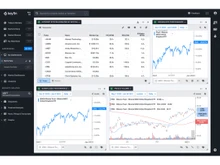
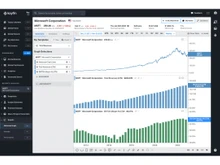
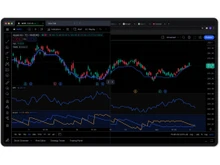
Koyfin focuses on clear, professional-grade data visualization. Its multi-panel dashboards let users track companies, sectors, and economic indicators side-by-side. TradingView dominates in technical charting, offering hundreds of built-in indicators, drawing tools, and custom Pine Script coding for strategy development.

  • Community & Collaboration

Koyfin is more research-oriented and doesn’t emphasize social interaction, but allows sharing dashboards and reports. TradingView has a massive global trading community where users publish ideas, scripts, and live analyses, encouraging learning and collaboration.

  • Customization & Interface

Koyfin’s interface is minimal and professional, allowing deep customization of charts, watchlists, and financial tables. TradingView’s interface is visually rich and interactive, providing traders with drag-and-drop tools, layouts, and scripting flexibility.

  • Platform & Accessibility

Koyfin runs on web browsers with cloud syncing, making it accessible on any device with an internet connection. TradingView is available on web, desktop, and mobile apps, allowing real-time alerts and analysis anywhere.

  • Community & Social Features

Koyfin focuses more on data and research, offering limited community engagement but strong professional sharing tools for reports and visuals. TradingView, on the other hand, thrives on its social ecosystem, where users can share charts, discuss market moves, and follow top traders, making it a hub for community learning and collaboration.

  • Integration & Accessibility

Koyfin supports web-based access and integrates with portfolio tools, making it easy to track multiple assets and build watchlists in one place. TradingView connects directly with major brokers for in-platform trading, along with mobile and desktop apps that let traders act instantly on analysis.

When to Choose Koyfin or TradingView?

Factor Choose Koyfin if… Choose TradingView if…
Primary Goal You need deep data visualization and financial research You rely on live charts and technical analysis
Experience Level You’re an investor or analyst focused on fundamentals You’re a trader focused on market timing
Customization Needs You prefer customizable dashboards and data tables You need flexible chart scripts and indicators
Community Focus You prefer a research-first approach You enjoy engaging with a global trader network
Integration Needs You want Excel integration and portfolio tracking You want broker integration and real-time trading
Device Preference You mainly work on a desktop or the web You need a mobile-friendly, trading-ready setup

Final Verdict: Koyfin or TradingView?

Koyfin is best for investors who prioritize research, analytics, and macro-level insights. It’s a perfect tool for portfolio managers and finance professionals who need clarity and depth in their data. TradingView, however, shines for traders who depend on live market data, customizable charts, and community insights to guide short-term trading decisions.

In short, Koyfin is ideal for data-driven investing, while TradingView excels at real-time trading and technical analysis.

Add Software to Compare

close

Recommended Products

20,000+ Software Listed 20,000+ Software Listed

Best Price Guaranteed Unbiased Comparison

Free Expert
                        Consultation Read Authentic Reviews

2M+ Happy Customers 500,000+ Monthly Users