Jaeger Software Pricing, Features & Reviews
What is Jaeger?
Jaeger is an open-source application performance monitoring tool that helps developers see how different parts of a complex software system work together.
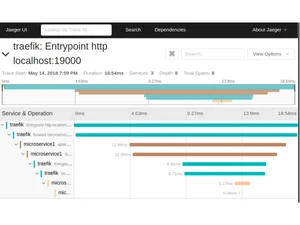
It tracks and records the path of each request as it moves through services, so teams can understand delays or errors in real time.
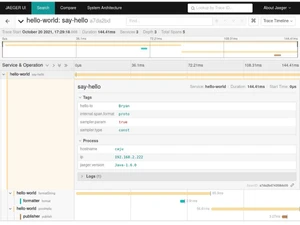
Jaeger shows detailed trace data and visual timelines that make it easier to find slow operations or performance bottlenecks. It' especially useful in modern systems where many services talk to each other.
The tool helps improve reliability by showing where problems happen. Developers can filter and search traces to debug issues faster. Jaeger works with many programming languages and integrates with popular monitoring systems.
It helps teams make applications faster, more stable, and easier to maintain. It is widely used in cloud and microservices environments to improve performance and user experience.
Why Choose Jaeger Software?
- Open Source: Free to use with community support.
- Distributed Tracing: Tracks requests across multiple services.
- Find Bottlenecks: Detects slow parts of your application.
- Root Cause Analysis: Helps locate the source of errors.
- Service Dependency Graphs: Visualizes how services interact.
- OpenTelemetry Support: Works with standard tracing protocols.
- Multiple Storage Options: Stores trace data in systems like Elasticsearch or Cassandra.
- Highly Scalable: Handles large volumes of trace data easily.
- Cloud-Native Ready: Compatible with Kubernetes and cloud setups.
- Modern Web UI: Easy-to-use interface for exploring traces.
- Adaptive Sampling: Collects only relevant traces to reduce overhead.
- Service Performance Metrics: Monitors request times, errors, and latency.
- Backward Compatibility: Supports older trace formats like Zipkin.
- Improves Observability: Makes complex applications easier to understand.
Benefits of Jaeger Software
- Integrates With Other Tools: Works with Prometheus, Grafana, and more.
- Flexible Configuration: Customize setup for different environments.
- Trace Visualization: Shows detailed timelines of each request.
- Latency Insights: Highlights where delays occur.
- Fast Debugging: Helps developers fix issues quickly.
- Multi-Language Support: Works with many programming languages.
- Active Community: Benefit from contributions and updates from the community.
- Flexible Deployment: Can run standalone or with telemetry collectors.
- Efficient Trace Storage: Keeps trace data organized and accessible.
- Vendor Neutral: Avoids dependency on proprietary software.
- Microservices Friendly: Designed for cloud-native microservice architectures.
- Detailed Span Data: Captures rich information about each request.
- Dependency Maps: Shows service relationships visually.
- DevOps Friendly: Helps SREs and engineers improve reliability.
Jaeger Pricing
Jaeger price is available for FREE at techjockey.com. The pricing model is based on different parameters, including extra features, deployment type, and the total number of users. For further queries related to the product, you can contact our product team and learn more about the pricing and offers.


 Distributed Tracing