linkedin
background
StockCharts logo

StockCharts

Brand: StockCharts

Be the first to Reviews

Write a Review

Have Questions?

StockCharts is an online charting and analysis platform that helps traders track stock market trends with interactive charts and technical indicators. ...Read more

img

Get Free Expert Consultation

Let us know your business needs clearly

Advice

Verified & Trusted
Vendors

Payment

Safe & Secure
Payment

Guaranteed

Personalized
Experts Support

Starting at $ 19.95

Features

  • check_icon Core Features
  • check_icon Order Execution
  • check_icon Research and Analysis
  • check_icon Technical Analysis
  • check_icon Fundamental Analysis
  • See all img

StockCharts Software Pricing, Features & Reviews

What is StockCharts?

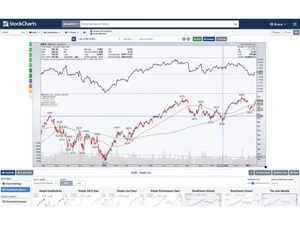
StockCharts is a data visualization tool that helps traders and investors track stock market trends. It provides interactive charts, technical indicators, and real-time market data to help users make informed decisions. The platform supports various chart types like candlestick, line, and bar charts, making it easier to analyze stock movements. StockCharts offers tools for technical analysis, including moving averages, Bollinger Bands, RSI, MACD, and trendlines.

It also provides customizable charting options to suit different trading strategies. Users can create watchlists, set alerts, and track multiple stocks at once. The platform is useful for beginners and experienced traders, offering educational resources, market commentary, and insights. It supports multiple asset classes, including stocks, ETFs, commodities, and cryptocurrencies. StockCharts is available in free and premium versions, with advanced features accessible through paid subscriptions.

Why Choose StockCharts Software?

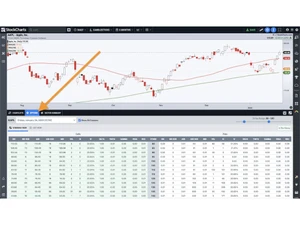
  • Advanced Charting Tools: Interactive charts with customizable indicators (RSI, MACD, etc.) and multiple chart types.
  • Market Breadth & Relative Strength: Features like Bullish Percent Index and RRG charts for trend analysis.
  • SharpCharts & ACII: Web-based charting with annotations and a desktop app (StockChartsACP) for advanced users.
  • StockChartsACP: Standalone desktop platform for faster, more customizable charting.
  • ChartBooks & Watchlists: Save and organize charts in portfolios and track securities efficiently.
  • Educational Resources: Free tutorials, ChartSchool, and expert insights (e.g., John Murphy).
  • Affordable Pricing: Free basic charts; paid plans (Extra, PRO) unlock more features.
  • Reliable Data & Performance: High-quality market data with real-time options (subscription-based).
  • Community & Expert Analysis: Learn from professional traders and engage with an active community.
  • Integration & Alerts: Set custom alerts and access APIs for automated trading (higher-tier plans).

Benefits of StockCharts Software

  • Custom Scans with Technical Filters: Screen stocks/ETFs using 100+ predefined or user-defined technical criteria.
  • Seasonality Charts: Visualize historical price patterns for specific times of the year.
  • Ratio Charts: Compare two securities (e.g., stock vs. sector, gold vs. dollar) in a single chart.
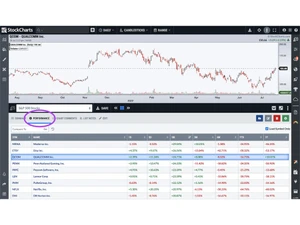
  • PerfCharts (Performance Charts): Instantly compare multiple assets' performance over time.
  • Dynamic Price Alerts: Get notified when price/indicator conditions are met (even when logged out).
  • Point & Figure Charts: Specialized charting for traditional price pattern analysis.
  • Ad-Free Experience (Pro Plans): No distractions with full-screen, clean charting.
  • Pre-Market & After-Hours Data: Track extended-hours price action (with real-time subscriptions).
  • SCTR (StockCharts Technical Rank): A proprietary scoring system ranking stocks based on momentum and trend strength.
  • Multiple Data Sources: Choose from different feed providers (e.g., BATS, NYSE, Nasdaq) for accuracy.
  • One-Click Pattern Recognition: Auto-detect chart patterns like head & shoulders, flags, etc.
  • Customizable Dashboards: Arrange charts, watchlists, and indicators in a single workspace.
  • Backtesting Capabilities: Test trading strategies using historical data (limited in web version, full in ACP).
  • Dividend & Earnings Overlays: Visualize key events directly on price charts.
  • Mobile-Optimized Charts: Access and analyze charts on-the-go via browser (no dedicated app).

StockCharts Pricing in UAE

StockCharts price starts at $19.95 at techjockey.

The pricing model is based on different parameters, including extra features, deployment type, and the total number of users. For further queries related to the product, you can contact our product team and learn more about the pricing and offers.

StockCharts Pricing & Plans

Basic
  • Technical Indicators per Chart-25
  • Technical Overlays per Chart-25
  • Ad-Free Charting
  • Intraday Charting
  • Available Real-Time Data
  • Saved Chart Storage
  • Save Settings As Chart Templates
  • Save Chart Annotations
  • Multi-Chart Layouts in ACP
  • Trade Directly From StockCharts
    • Ram
    • Quantity
Starting at $ 19.95
Extra
  • Technical Indicators per Chart-25
  • Technical Overlays per Chart-25
  • Ad-Free Charting
  • Intraday Charting
  • Available Real-Time Data
  • Saved Chart Storage
  • Save Settings As Chart Templates
  • Save Chart Annotations
  • Multi-Chart Layouts in ACP
  • Trade Directly From StockCharts
    • Ram
    • Quantity
Starting at $ 29.95
Pro
  • Technical Indicators per Chart-25
  • Technical Overlays per Chart-25
  • Ad-Free Charting
  • Intraday Charting
  • Available Real-Time Data
  • Saved Chart Storage
  • Save Settings As Chart Templates
  • Save Chart Annotations
  • Multi-Chart Layouts in ACP
  • Trade Directly From StockCharts
    • Ram
    • Quantity
Starting at $ 49.95

Get StockCharts Demo

We make it happen! Get your hands on the best solution based on your needs.

Interacted

StockCharts Features

Core Features

  • icon_check Portfolio Management Track and analyze investment holdings, returns, and asset allocation in real time.
  • icon_check Market Data Real-time and historical stock price feeds, trade volume, and market indices for analysis.
  • icon_check Watchlist A customizable list for monitoring preferred stocks, providing real-time updates on price and volume.
  • icon_check Charting Tools Visual tools for analyzing stock trends and patterns using technical indicators and price movements.
  • icon_check Stock Screener Filters stocks based on specific criteria like market cap, P/E ratio, or price movement.
  • icon_check Order Control Tools to manage, modify, and cancel buy or sell orders efficiently on the trading platform.
  • icon_check Order Execution Automated system to process buy/sell orders directly via the broker and stock exchange.

Order Execution

  • icon_check Limit Order An order to buy/sell at a specific price or better, ensuring price control but not guaranteed execution.
  • icon_check Market Order Buy/sell immediately at the current market price, ensuring execution but no price control.
  • icon_check Stop (Loss) Order Automatically sells stock when it drops to a pre-set price to minimize losses.
  • icon_check Stop Limit Orders Combines a stop-loss order with a limit order to sell/buy once a set price is triggered.
  • icon_check Trailing Stop Order Automatically adjusts stop price as the market price moves in favor of the position.

Research and Analysis

  • icon_check Multi-Timeframe Analysis Analyzes price trends across different timeframes for better decision-making.
  • icon_check Sentiment Analysis Evaluates market sentiment from news and social media to gauge stock trends.
  • icon_check Advanced Order Flow Analysis Tracks and analyzes buying and selling activity across the market.
  • icon_check Analyst Ratings Displays professional analyst opinions on stocks, including buy, hold, or sell recommendations.

Technical Analysis

  • icon_check Smart drawing tools Customizable tools to draw patterns like support, resistance, and Fibonacci retracements.
  • icon_check Trendlines Visual representation of stock price trends over time to predict future movements.
  • icon_check Technical Indicators Tools like RSI and MACD for analyzing stock price momentum and direction.
  • icon_check Custom Indicators Create and apply personalized technical indicators for unique trading strategies.
  • icon_check Automated Technical Patterns Detection Automatically identifies patterns like head and shoulders or flags.

Fundamental Analysis

  • icon_check Industry Analysis Compares stock performance against industry benchmarks for relative valuation.
  • icon_check Balance Sheet Shows a company's assets, liabilities, and shareholders’ equity for financial health analysis.
  • icon_check Income Statement Displays a company’s revenue, expenses, and profitability over a specific period.
  • icon_check Financial Ratios Key metrics like P/E and P/B ratios to evaluate stock value relative to financial performance.
  • icon_check Cash Flow Statements Tracks cash inflows and outflows to assess company liquidity and operational efficiency.
  • icon_check Earnings Forecasts Predicts future earnings based on historical data and market conditions.
  • icon_check Company Valuation Models Estimates a company’s value based on DCF, NPV, and other valuation methods.

Backtesting and Optimization

  • icon_check Historical Data Simulation Tests trading strategies against past data to assess their effectiveness.
  • icon_check Paper Trading Practice trading without risking real capital using simulated environments.
  • icon_check Strategy Tester Evaluates the performance of trading strategies before deploying them in live markets.
  • icon_check Strategy Optimization Fine-tunes trading strategies by adjusting parameters for improved performance.
  • icon_check Monte Carlo Simulation Uses probabilistic models to forecast trading outcomes in uncertain conditions.

Risk Management

  • icon_check Diversification Analysis Analyzes portfolio risk by evaluating asset allocation and exposure to different sectors.
  • icon_check Performance Analytics Tracks portfolio and trade performance through returns, drawdowns, and risk measures.
  • icon_check Risk Calculator Estimates potential profit/loss scenarios based on trade size and risk percentage.
  • icon_check Position Sizing Calculator Determines the appropriate trade size based on risk tolerance and market conditions.
  • icon_check Stop-Loss Automation Automatically implements stop-loss rules to limit potential trading losses.
  • icon_check Maximum Drawdown Analysis Measures the largest peak-to-trough decline in a portfolio's value.

Trading Options

  • icon_check Swing Trading A strategy that captures shortto medium-term gains from price swings.
  • icon_check Intraday Trading Buy and sell stocks within the same trading day to capitalize on short-term movements.
  • icon_check Paper Trading Practice trading without risking real capital using simulated environments.
  • icon_check Derivative Trading Trade derivatives like options, futures, and swaps based on underlying assets.
  • icon_check Algorithm Trading Executes trades based on pre-set algorithms without manual intervention.
  • icon_check Options Trading Allows the buying/selling of call and put options for speculative or hedging purposes.
  • icon_check Futures Trading Trade contracts to buy or sell assets at a future date at predetermined prices.
  • icon_check Forex Trading Enables trading in currency pairs based on fluctuations in the foreign exchange market.
  • icon_check Crypto Trading Buy/sell cryptocurrencies like Bitcoin and Ethereum on dedicated platforms.
  • icon_check Automatic Trading Uses automated systems to execute trades according to predefined criteria.
  • icon_check Rotational Trading Alternates investments between sectors, asset classes, or strategies based on market trends.
  • icon_check Spread Trading Speculative trading of the price difference between two assets.

Reporting & Analytics

  • icon_check Dashboards Visual displays of key metrics like portfolio performance, risk levels, and trade history.
  • icon_check Portfolio Tracking Real-time tracking of your investments, including value, returns, and allocations.
  • icon_check Customizable Reports Tailored reports to analyze performance, tax implications, or investment behavior.
  • icon_check Risk Analytics Analyzes portfolio risks by measuring volatility, drawdowns, and exposure.
  • icon_check Trade Performance Attribution Breaks down the source of trading gains or losses for better analysis.

Account Management

  • icon_check Customizable User Interface Allows users to personalize the layout and appearance of the platform.
  • icon_check Account Summary Reports Provides detailed summaries of account balances, holdings, and transactions.
  • icon_check Audit Trail Tracks and logs user activity to maintain compliance and security.
  • icon_check Multi-Factor Authentication (MFA) Adds a second layer of security to protect accounts from unauthorized access.
  • icon_check User Access Management Controls who can execute trades, view reports, or manage funds based on assigned privileges.

Integrations

  • icon_check Social Media Integration Connects with social platforms to track sentiment, discussions, and trends.
  • icon_check API Integration Connects with external APIs for custom trading, data feeds, or system automation.
  • icon_check Third Party Integration Supports tools like research platforms, analytics software, and financial news services.
  • icon_check Market Data Integration Links the platform to real-time market data feeds for timely trading decisions.
  • icon_check Brokerage Integration Connects to brokerage accounts for seamless trading and order execution.
  • icon_check Multi-Language Support Provides the ability to use the software in various languages for global accessibility.
  • icon_check Cloud Data Integration Stores and accesses trading data through cloud services for scalability.

Alerts & Notifications

  • icon_check Price Alert Notifies users when stock prices reach a specific target or threshold.
  • icon_check Push Notifications Sends updates directly to mobile devices for timely decisions.
  • icon_check Volume Alerts Signals abnormal trading volume, indicating potential market movements.
  • icon_check Real-Time Market Updates Sends alerts on price changes, market movements, and breaking news.
  • icon_check News Alert Delivers important financial news related to specific stocks or sectors.
  • icon_check Sentiment Alerts Notifies users of changes in market sentiment based on social or news analysis.

StockCharts Specifications

  • Supported Platforms :
  • Device:
  • Deployment :
  • Suitable For :
  • Business Specific:
  • Business Size:
  • Customer Support:
  • Training:
  • Language:
  • Ubuntu Windows iOS Android MacOS Linux
  • DesktopMobileTabletiPad
  • Web-Based
  • Stock Market
  • All Businesses
  • Small Business, Startups, Medium Business, Enterprises, SMBs, SMEs, MSMBs, MSMEs,
  • Email, Communities
  • Videos
  • English

StockCharts Reviews and Ratings

banner

Would you like to review this product?

Submit Reviews

StockCharts Company Details

Brand Name StockCharts
Information StockCharts is the web's leading technical analysis and financial charting platform for online retail investors.
Founded Year 1999
Director/Founders Chip Anderson
Company Size 1-100 Employees

StockCharts FAQ

A The starting price of StockCharts in UAE is $19.95 on Techjockey.
A Yes, StockCharts offers an Android and iOS mobile app.
A StockCharts works on Windows and MacOS operating systems.
A Yes, StockCharts provide a free trial.
A StockCharts is a data visualization tool that allows users to create customized stock charts, apply technical indicators, set alerts, and use advanced scanning tools to analyze market trends.
A StockCharts is used by traders, investors, financial analysts, and market researchers to analyze stock trends and make informed decisions.
A StockCharts does not offer a free demo, but it provides a free trial.
A Yes, StockCharts offers a free version with basic features, while advanced tools require a paid subscription.
A Users can generate different chart types, including candlestick, bar, line, and seasonality charts, with various customization options.
A StockCharts is primarily a standalone tool and does not directly integrate with brokerage platforms for trading execution.

StockCharts Alternatives

See All

20,000+ Software Listed 20,000+ Software Listed

Best Price Guaranteed Unbiased Comparison

Free Expert Consultation Read Authentic Reviews

2M+ Happy Customers 500,000+ Monthly Users