![]()
Description
Pricing
Features
Specification
Review
Compare
FAQs
Alternatives


![]() View Gallery
View Gallery
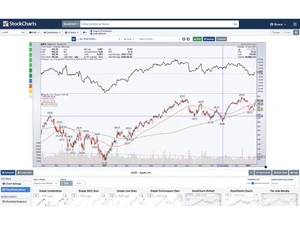
Brand: StockCharts
StockCharts is a powerful charting and analysis platform built for active traders, technical analysts, and investors. It delivers advanced charting tools, custom scans, real-time alerts, and portfolio tracking. ...Read more

Get Free Expert Consultation
Let us know your business needs clearly
Verified & Trusted
Vendors

Safe & Secure
Payment

Personalized
Experts Support
$ 19.95 /Month
Features
 Core Features Order Execution Research and Analysis Technical Analysis Fundamental Analysis
 See all ![]()
We make it happen! Get your hands on the best solution based on your needs.


Core Features
Order Execution
Research and Analysis
Technical Analysis
Fundamental Analysis
Backtesting and Optimization
Risk Management
Trading Options
Reporting & Analytics
Account Management
Integrations
Alerts & Notifications
Have recommended this product
Overall Score
Review this product
Your valuable feedback helps others like you make a better decision.
Verified reviewer:
Freelancer, Market Research
Individual
Software user since: < 6 months
Reviewed on: Dec 26, 2024
| Brand Name | StockCharts |
| Information | StockCharts is the web's leading technical analysis and financial charting platform for online retail investors. |
| Founded Year | 1999 |
| Director/Founders | Chip Anderson |
| Company Size | 1-100 Employees |


