Sigma vs Tableau: Which Business Intelligence Software Is Right For You?
Businesses that are considering the Business Intelligence Software category can find it difficult to choose between Sigma and Tableau. The two platforms help organizations to utilize visualization, analytics, and collaborative tools to convert raw data into value, which inspires smarter decision-making.
Sigma offers an experience of data exploration in the spreadsheet format on the data warehouses in the clouds themselves, which is more appropriate when teams need simplicity and easy access in real-time. Tableau, conversely, is distinguished by its high-pressure visual analytics, elaborate dashboards, and long-term customization, which are used in more sophisticated analytics in other industries.
This guide will address their key features, price, and overall application so that you can decide on the optimal solution, which can be beneficial in your business.
Key Differences Between Sigma vs Tableau
- User Interface and Experience: Sigma has a spreadsheet-like interface that can be easily used to collaborate in real time, whereas Tableau has a more sophisticated drag-and-drop design that takes more expertise.
- Data Architecture and Performance: Sigma has a cloud-native design with a guarantee of real-time data that is always available, whereas Tableau improves performance using its Hyper extract engine for faster in-memory analysis of large datasets. Live connections may run slower depending on the data source and query complexity..
- Visualization and Customization: Sigma offers easy visual choices with little customization, and Tableau offers robust and versatile, and very creative visualization choices.
Sigma vs Tableau: Comparison Table
| Feature |
Sigma |
Tableau |
| Data Connectivity |
Connects directly to cloud data warehouses in real time. |
Connects to multiple sources, including on-premise and cloud. |
| Performance |
Relies on warehouse power for fast live queries. |
Uses Hyper engine; faster with extracts than live data. |
| Collaboration |
Enables real-time multi-user workbook editing. |
Collaboration via shared, published dashboards only. |
| Learning Curve |
Simple, easy for non-technical users to get started. |
Advanced, requires training to master advanced visualizations. |
| Data Governance |
Uses warehouse security and offers lineage tracking. |
Has built-in governance; advanced tools need extra licenses. |
| Self-Service Analytics |
Easy for non-technical users to analyze data independently. |
Requires more training for effective self-service analysis. |
| Write-back Capabilities |
Allows direct data entry into cloud warehouses. |
No native write-back functionality is supported. |
| AI/NLP Features |
Includes “Ask Sigma” for AI-assisted natural queries. |
Offers “Ask Data” and “Explain Data” for insights. |
| Primary User |
Ideal for business users familiar with spreadsheets. |
Best suited for analysts and data scientists. |
| Support |
Provides responsive cloud-based customer support. |
Offers global customer support and detailed documentation. |
| Pricing |
Price on request at Techjockey. |
Starts at USD 900 per year at Techjockey. |
Detailed Feature Comparison of Sigma and Tableau
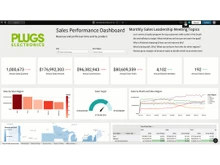
Sigma provides a spreadsheet-like interface, which enables one to make reports based on real-time data. Users are able to do calculations, filter columns, and navigate datasets without writing code. Tableau, on the other hand, is dedicated to data-driven decision-making that is made through highly interactive dashboards, allowing drag and drop interaction, detailed visual narrative, and presentable reporting.
- Data Blending and Querying
Sigma allows one to query in real-time using a cloud data warehouse, and one can mix data sources in the same workbook, and they work perfectly. Tableau also allows data blending, although it frequently uses data extracts, which can be sluggish to use. Live connections are available and can be used to restrict exploration to large datasets or complicated queries.
- Data Visualization and Discovery
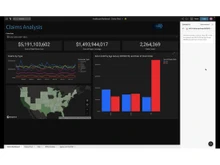
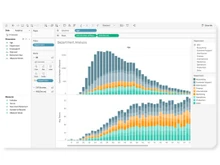
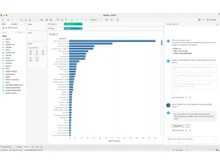
Tableau is strong at producing highly sophisticated, highly customizable visualizations, including maps, scatter plots, and interactive charts to discover data in depth. Sigma has simpler visualizations that provide grid-based layouts, are fast, and are oriented to simple exploration. Whereas Tableau is more focused on narrative and the depth of insights, Sigma is more focused on real-time analysis and business user usability.
- Calculated Fields and Data Filtering
Sigma facilitates in-grid calculations and column-level filters, which enable users to develop ad-hoc analysis without technical skills. Tableau offers more enhanced calculated fields that have complicated formulas, conditional logic, and dynamic filtering. It allows more sophisticated analytics and much more interactive dashboards, which allows Tableau to be more well-integrated with analytical-intensive use cases.
Sigma is integrated with cloud warehouse protection, including audit trails, lineage tracking, and access control, as a way of ensuring data integrity. Tableau has built-in governance features to control the access of users, permissions, as well as the tracking of who has been using it. There are more sophisticated governance features that need further licenses. Both systems are concerned about safe data processing, but they are different in their flexibility and complexity.
When to Choose Sigma and Tableau?
| Use Case / Scenario |
When to Choose Sigma |
When to Choose Tableau |
| Real-Time Cloud Data Analysis |
Ideal for instant insights using live cloud data connections. |
Best for optimized analysis through in-memory data extracts. |
| Collaboration Across Business Teams |
Enables real-time editing and instant sharing within workbooks. |
Great for sharing polished dashboards with interactive viewing access. |
| Integration with Data Stack |
Works seamlessly with Snowflake, BigQuery, and Redshift systems. |
Connects easily to diverse data sources and databases. |
| Speed of Setup and Adoption |
Quick to deploy with minimal training for new users. |
Requires setup time but supports advanced analytical capabilities. |
| Custom Analytics Development |
Suitable for interpreting existing KPIs and simple reports. |
Ideal for creating complex, predictive, and storytelling visualizations. |
Final Verdict: Sigma or Tableau
Sigma and Tableau are both advanced SaaS tools in the Business Intelligence Software market, but with different purposes.
Sigma is more appropriate when the team desires a cloud-native platform with a familiar spreadsheet interface, real-time access to data, and easy collaboration. On the other hand, Tableau would be most appropriate when data professionals need advanced analytics, in-depth visualizations, and tailored dashboards to help them gain a deeper understanding.
Select Sigma in case you are more concerned with simplicity and real-time data exploration. However, select Tableau in case you pay attention to the strong visualization and sophisticated reporting features.
Contact our software professionals or the Techjockey Team to get a free consultation and demo to find the perfect solution to your business.


 6 Ratings & 1 Reviews