Tableau vs Spotfire: Which Data Analytics Platform Is Right for You?
Choosing between Tableau and TIBCO Spotfire is one of the most common decisions for enterprises seeking an advanced business intelligence (BI) and data analytics platform. Both tools deliver powerful dashboards, interactive visualizations, and enterprise-scale analytics, but they differ significantly in design philosophy, advanced capabilities, AI automation, industry focus, and total cost of ownership.
Tableau has built a strong reputation as the global leader in data visualization, widely used by business teams, analysts, and executives for its intuitive interface and presentation-ready dashboards. Spotfire, however, is the favorite among data scientists, engineering teams, and industries that rely on complex data models, real-time analytics, and automated insights.
Deciding between Tableau’s visual storytelling strengths and Spotfire’s data science-led analytics can be challenging, especially when teams include users with diverse skill sets.
In this comprehensive guide, we’ll explore all major differences, feature comparisons, use cases, pricing, advanced capabilities, and FAQs to help you select the best BI tool for your organization.
TL;DR
- Visualization Strength: Tableau delivers the best-in-class, polished, and highly customizable visual dashboards.
- Advanced Analytics: Spotfire includes stronger built-in AI, automation, predictive analytics, and statistical modeling.
- Ease of Use: Tableau is more beginner-friendly; Spotfire is optimized for technical and data science teams.
Spotfire vs Tableau Comparison Table
| Basis |
Tableau |
Spotfire |
| Pricing |
Starting at USD 900 |
Price on request |
| Ease of Use |
Very beginner-friendly; drag-and-drop visuals |
Steeper learning curve; ideal for technical teams |
| Visualization Quality |
Industry-leading, highly polished, customizable |
Clean but more functional than aesthetic |
| Advanced Analytics |
Strong with integrations and Einstein Discovery |
Exceptional, native AI, statistical models, automation |
| Data Handling & Scale |
Great for structured BI data |
Excellent for large datasets, IoT, geospatial & real-time |
| Collaboration |
Strong enterprise collaboration & permissions |
Strong for data engineering workflows |
| APIs & Extensibility |
Good extensibility; strong developer community |
Highly extensible; strong for scientific and industrial use cases |
| Support |
Premier Salesforce-backed |
Strong technical and industry-specific support |
| Ideal For |
Business users, analysts, decision-makers |
Data scientists, engineering teams, and R&D-heavy industries |
What are the Additional Differences Between Spotfire and Tableau?
- AI & Predictive Insights: Spotfire includes built-in AI-driven recommendations, data wrangling, and automated workflows. Tableau relies more on Salesforce Einstein Discovery for similar capabilities.
- Data Connectivity & Scale: Spotfire handles large datasets, IoT streams, and industrial data exceptionally well. Tableau works best with structured business data and cloud connectors.
- Dashboard Customization: Tableau offers more design freedom and polished presentations. Spotfire dashboards prioritize analytical depth rather than visual flair.
- Industry Use Cases: Tableau is preferred in finance, retail, and corporate analytics. Spotfire leads in energy, manufacturing, pharma, and R&D due to its scientific modeling features.
- Collaboration & Governance: Tableau excels with enterprise governance tools (esp. with Tableau Server + Cloud). Spotfire offers stronger automation and data lineage features.
Detailed Feature Comparison of Tableau and Spotfire
- Data Visualization & Dashboard Design
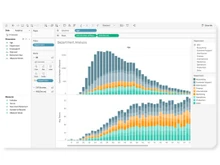
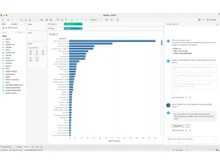
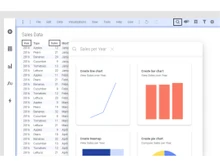
Tableau is often celebrated as the gold standard in data visualization. Its design-driven interface allows users to create visually stunning dashboards with ease. Colors, grid layouts, animations, and interactivity are highly refined. Spotfire’s visuals are powerful but focus more on rapid analytics rather than presentation elegance. Although dashboards can be customized, they tend to look more technical than polished.
- Data Processing & Real-Time Analytics
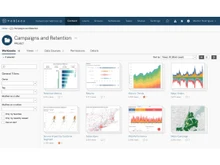
Spotfire excels in environments that require real-time data ingestion, such as IoT devices, sensors, manufacturing systems, and energy platforms. It can handle high-volume, streaming data with ease. Tableau supports real-time analytics but often requires additional tools (e.g., Tableau Data Management Add-On or third-party connectors). For industries with fast-moving data, Spotfire is generally superior.
- Advanced Analytics, ML, and Predictive Modeling
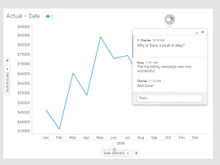
Spotfire includes built-in predictive analytics, AI recommendations, and seamless integration with Python, R, MATLAB, and even SAS. Its “Recommendations” engine automatically suggests the best analytical techniques. Tableau supports similar capabilities but depends more heavily on external tools and the Salesforce ecosystem for automated ML.
- Data Wrangling & Transformation
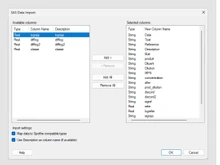
Spotfire includes a powerful, AI-assisted data wrangling interface that helps users clean, blend, and transform data efficiently. Tableau has strong data preparation features as well, especially with Tableau Prep, but it may require more manual effort and external components.
- User Experience & Learning Curve
Tableau is known for its intuitive drag-and-drop interface suitable for beginners, business users, and executives. Spotfire’s interface is more technical, designed to support statistical modeling, advanced calculations, and deep data exploration. For teams with mixed expertise, Tableau may be easier to adopt.
Tableau integrates seamlessly with Salesforce CRM, Snowflake, Google Cloud, AWS, and other popular BI ecosystems. Spotfire, however, integrates better with industrial systems, laboratory software, scientific instruments, and IoT ecosystems, making it stronger for high-tech or engineering-heavy organizations.
- Mobile Analytics & Deployment
Both platforms offer mobile dashboards and cloud/on-premise deployments. Tableau’s mobile experience is highly polished, while Spotfire’s mobile app is optimized for data exploration and inline analytics.
When to Choose Tableau or Spotfire?
| Use Case |
Choose Tableau If… |
Choose Spotfire If… |
| Data Visualization |
You want presentation-grade dashboards |
You need analytics-focused dashboards |
| Predictive Analytics |
You rely on external tools or Salesforce |
You want built-in AI/ML capabilities |
| Ease of Use |
Your team includes beginners or casual users |
Your team includes data scientists or engineers |
| Big Data / IoT |
You work with traditional BI datasets |
You handle streaming data, IoT, sensors, industrial equipment |
| Industry |
Perfect for finance, marketing, HR, retail |
Ideal for pharma, energy, chemicals, manufacturing |
| Customization |
You want highly polished visual freedom |
You want deep analytical customization |
| Collaboration |
You use Tableau Cloud or Server |
You need automated workflows across the data lifecycle |
Final Verdict: Spotfire or Tableau?
Both Tableau and Spotfire are exceptional tools in the BI market, but they serve different audiences and analytics goals. Choose Tableau if your priority is visual excellence, ease of use, enterprise reporting, and broad business adoption. It’s ideal for companies that want beautiful dashboards, intuitive workflows, and seamless cloud integration.
Choose Spotfire if you require advanced analytics, real-time data streaming, predictive modeling, or highly technical workflows. It’s especially powerful for industries that rely on scientific, engineering, or industrial data. Ultimately, the right tool depends on your organization’s technical maturity, data complexity, and analytics goals.
Want personalized guidance? Reach out to our software experts or the Techjockey Team for a free consultation and demo to help you choose the best BI platform.


 5 Ratings & 0 Reviews