![]()
Description
Pricing
Features
Specification
Review
Compare
FAQs
Alternatives


![]() View Gallery
View Gallery
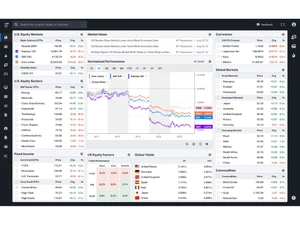
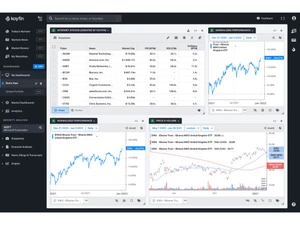
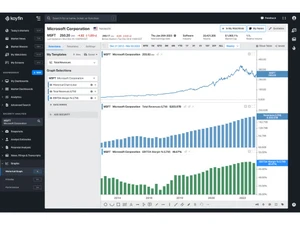
Brand: Koyfin
Koyfin is a stock market and investment analytics platform built for financial advisors, analysts, and individual investors. It offers live market data, customizable dashboards, and advanced visual tools—all in one place....Read more

Get Free Expert Consultation
Let us know your business needs clearly
Verified & Trusted
Vendors

Safe & Secure
Payment

Personalized
Experts Support
Starting at $ 49.00
Features
 Core Features Order Execution Research and Analysis Technical Analysis Fundamental Analysis
 See all ![]()
We make it happen! Get your hands on the best solution based on your needs.


Core Features
Order Execution
Research and Analysis
Technical Analysis
Fundamental Analysis
Backtesting and Optimization
Risk Management
Trading Options
Reporting & Analytics
Account Management
Integrations
Alerts & Notifications
Have recommended this product
Overall Score
Review this product
Your valuable feedback helps others like you make a better decision.

“Koyfin Review: Best Charting Software for The Stock Market”
4.8
Review by: Modest Money
| Brand Name | Koyfin |
| Information | Koyfin is a financial data and analytics platform for researching stocks and understanding market trends. |
| Founded Year | 2016 |
| Director/Founders | Rich Meatto, Rob Koyfman |
| Company Size | 1-100 Employees |


