Business Intelligence vs Data Analytics: Key Differences & Use Cases

Data is the most valuable asset for any business. It provides critical insights that help identify both the strengths and weaknesses in your operations. According to a report by McKinsey, companies that effectively use data in their workflows are 23 times more likely to acquire customers and 6 times more likely to retain them.
When it comes to leveraging data, Business Intelligence vs Data Analytics is a common comparison that often arises. While both are essential for data-driven decision-making, they serve different purposes. Understanding these differences can help you make smarter strategic choices and better determine what will drive client growth and long-term success.
Business intelligence often focuses on historical data and reporting to support business decisions, whereas data analytics dives deeper into patterns and trends to forecast future outcomes and optimize processes. Both play a crucial role in identifying gaps and reinforcing solid structures within your organization.
Let’s interpret the key differences and how each can benefit your business.
What is Business Intelligence (BI)?
Business intelligence in action is to check out what’s going on in your business and what has already happened in the past. With BI, you can turn raw data into useful reports, charts, and dashboards to make your operations better.
In simple terms, BI is the process where you collecting, organizing, and visualize data, and make decisions based on that. It generally shows you the current state of your business.
How BI Actually Works?

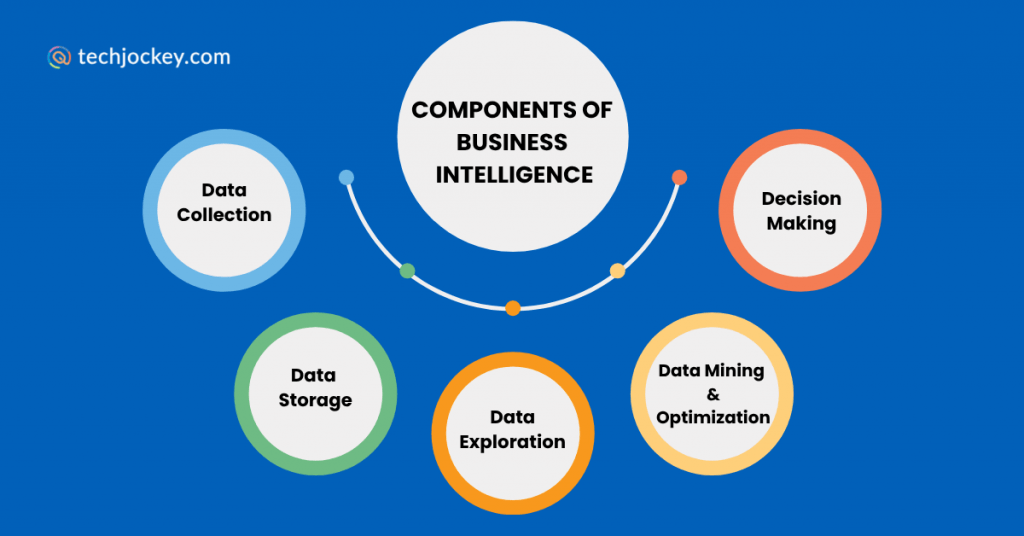
While BI gives you clear dashboards and reports on the surface, there’s a powerful process working in the background:
- Data Collection from multiple sources, like sales systems, emails, or third-party data.
- Data Storage in systems called data warehouses or marts.
- Data Exploration through reports and queries to find answers to specific questions.
- Data Mining & Optimization to uncover patterns and recommend better decisions.
- Final Decision Making, where insights meet human judgment.
This is a simple approach towards making smart decisions and planning for the long term.
Key Features of BI:
- It has dashboards that work in real-time and provide you the updated data.
- Offers in-depth reports that show your daily, weekly, or monthly performance
- You can view the Key Performance Indicators and track your goals.
- With real-time monitoring, you can spot issues faster.

Microsoft Power BI
Starting Price
₹ 1260.00 excl. GST
Who Uses BI?
Mostly business managers, operations teams, and executives who need quick answers like:
- How are sales this month?
- Are we meeting our targets?
- Which of the regions are underperforming?
BI is a complete toolset for the people involved in decision-making.
What is Data Analytics?
While business intelligence helps you make daily decisions, Data analytics gives you more clarity on what can happen next and what actions you must take.
It’s about predicting your future outcomes.
Business intelligence only focuses on what is happening or what has happened, but in data analytics, there is a team of data experts who dig deeper and ask questions like:
- Why did this happen?
- What’s likely to happen next?
- What should we do about it?

Zoho Analytics
Starting Price
₹ 1200.00 excl. GST
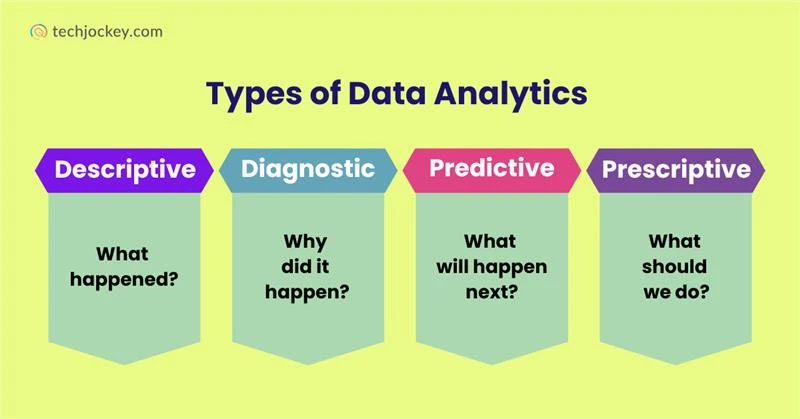
4 Types of Data Analytics Explained Simply

Let’s break this down with a simple example, like you are running an e-commerce store.
1. Descriptive Analytics – What happened?
It focuses on past events and uses reports and dashboards to find out the loopholes.
For example, Sales dropped by 10% last month. You’re looking at the facts.
2. Diagnostic Analytics – Why it happened?
In this, you find the root cause of declining sales in the past.
For example, Sales dropped because 20% of returning customers didn’t make a purchase.
3. Predictive Analytics – What will happen next?
This helps you forecast future outcomes using techniques like regression, machine learning, and time series analysis.
For example, If the trend continues, sales may drop again this month.
4. Prescriptive Analytics – What must we do next?
It’s the next step to predictions. It suggests further actions using big data and machine learning.
For example, offer a personalized discount to returning customers to increase conversions.

Datamatics TruBI
Starting Price
Price on Request
What’s the Real Goal of Data Analytics for Business?
With analytics, businesses can:
- Provide your customers with a better experience
- Lower business risks
- Experiment with different marketing strategies
- Refine budgets and financial planning
- Speed up new ideas
Who Uses Data Analytics in a Company?
- It’s for data analysts who look for patterns in customer behavior, website traffic, or product usage.
- Data scientists who build models to forecast sales or detect fraud.
- Executives and strategic planners who need data insights to update future business moves.

EasyInsights
Starting Price
₹ 21000.00 excl. GST
Key Differences Between Business Intelligence and Data Analytics
| Factor | Business Intelligence | Data Analytics |
|---|---|---|
| Focus | Past & present data | Trends & future outcomes |
| Goal | Operational decision-making | Strategic planning |
| Techniques | Reporting, dashboards | Statistical analysis, modeling |
| Users | Business managers | Analysts, data scientists |
| Tools | Power BI, Tableau | Python, R, SAS |
Here’s a detailed version of Business Intelligence vs Data Analytics:
Focus: Past & Present vs. Future
- Business Intelligence will see your past and your actual time data to present what is going on, or what has occurred in the past.
- Data Analytics, however, takes it one step further, revealing patterns and predicting what will come next.
Goal: Operational vs. Strategic Decisions
- BI enables tasks conducted on a daily basis, such as monitoring the KPIs, monitoring performance, or tracking areas lagging behind.
- Data analytics helps in long-term strategy, like planning a product launch or market change.
Techniques: Dashboards vs. Deep Analysis
BI uses tools such as dashboards, scorecards, and reports to make things easier to understand.
Data analytics involves statistical models, algorithms, and even machine learning to know about why” and what next”.
Users: Managers vs. Analysts
BI is used by business managers and operations teams to offer fast and high-level views of business performance.
Analytics allow data analysts, scientists, and strategic planners to test their hypotheses, investigate insights, and design actions to be taken in the future.
Tools: Reporting vs. Modeling Platforms
Some Business Intelligence software are Power BI, Tableau, and Qlik, but these are limited to visualisation and reporting purposes.
Python, R, and SAS are data analytics tools used in data exploration, modeling, and prediction.
Can BI and Data Analytics Work Together?
Of course, they can, and they should.
Most companies tend to believe that these two are competing technologies. Actually, they have distinct functions but complement each other perfectly.
BI Gives You Clarity; Analytics Gives You Foresight
Consider it in this manner:
- BI informs you what happens within your business currently.
- Analytics will allow you to learn what could happen in the future and how to deal with it.
Combined, they can tell you the whole image, including the present situation and the future prospect.
Case Study: An example of a Retailer
Consider that you are the manager of a retail chain.
- You can monitor daily sales, stocks, and customer footfall in every store using BI dashboards. You will notice that in two of your locations, there is a decline in sales.
- This is followed by using data analytics to determine why. Based on the analysis, these stores possessed a smaller number of returning customers and prices than their competitors who were close to them.
- You take further action with the predictive analytics to predict what the effect of a price adjustment will be.
- Lastly, you test the various strategies of offering discounts using prescriptive analytics and the one that delivers the best outcome.
In this manner, BI warns you, and analytics informs you.
Why Combining BI and Analytics Matters?
- Quicker decisions: BI offers up-to-date data of operational activities.
- Smart decisions: Analytics helps you to go into the depth of reasons and opportunities.
- Better plans: Both of these enable better plans that focus on the short and long-term decisions.
Combined with analytics, BI contributes to both efficiency and innovation and makes your business more proactive, more agile, and competitive.
Conclusion: What Should Your Business Do Next?
Business Intelligence vs Data Analytics are not competitors but rather complementary tools.
BI is useful to make sure you watch what is already occurring, whereas analytics provides you with the knowledge to plan what should occur next.
When you are new to it, start with BI as it explains it better. As you acquire more data, begin to embrace analytics as you make more intelligent, visionary decisions.
In the modern data-oriented world, a combination of both is a ticket towards being agile, informed, and competitive.
Mehlika Bathla is a passionate content writer who turns complex tech ideas into simple words. For over 4 years in the tech industry, she has crafted helpful content like technical documentation, user guides, UX content, website content, social media copies, and SEO-driven blogs. She is highly skilled in... Read more


