Top 7 Self-Service BI Tools to Simplify Your Data Journey in 2026

What if all your employees could look at data without depending on IT experts for help? That’s what makes Self-Service Business Intelligence (BI) successful.
It allows users who do not code to set up dashboards, spot changes in the data, and make decisions based on information that too in simple steps. The teams can use insights independently, which makes reporting faster and enhances their agility.
Picking the right tool in 2026 will make a big difference for your results. In this blog, we’ll feature the best self-service BI tools to assist in making better decisions.
Let’s move on.
What is Self-Service BI?
Self-service BI tools allow users to analyze and visualize data without relying on IT. These tools offer drag-and-drop interfaces, real-time dashboards, and easy data integration. They empower non-technical users to make data-driven decisions quickly and independently.
Traditional BI vs Self-Service BI
| Feature | Traditional BI | Self-Service BI |
|---|---|---|
| Who builds reports | IT/Data Analysts | Business Users |
| Time to insight | Slower, ticket-based | Faster, on-demand |
| Technical knowledge required | High | Low to moderate |
| Flexibility | Limited | High |
Traditional BI often relies on centralized reporting, where users must request reports from IT, leading to delays. Self-service BI shifts that power to end-users, enabling faster decisions and greater autonomy.
Why Self-Service BI is Crucial for Modern Businesses?
Nowadays, every business needs to use data to make better business decisions. Data helps companies understand their customers, improve products, and grow faster.
But many businesses face a problem: only the IT or data team can access the data. Other teams have to wait for reports. This slows down work and causes delays.
The Problem: Waiting for IT
When marketing, sales, or HR teams need data, they ask IT to prepare reports. IT teams have many tasks and cannot always respond quickly. This waiting can lead to missed chances or slow responses to problems.
The Solution: Self-Service BI
Self-Service BI tools let people in every team use data by themselves. These tools are easy to use. No coding or technical skills are needed.
Here’s how different teams use Self-Service BI:
- Marketing: Track ad campaigns and see which ones work best
- Sales: Watch sales targets and find top-performing salespeople
- HR: Check employee happiness, turnover, and hiring trends
- Operations: Monitor daily work, supply chain, and inventory levels
Self-Service BI helps teams find answers fast. It makes the company more flexible and ready to change. It turns data into actions.
Top 7 Self-Service Business Intelligence Tools
Self-Service BI helps businesses move faster and stay competitive. Here is the list of top 7 self-service business BI tools:
1. Power BI

Microsoft’s business intelligence tool, Power BI, helps businesses see the value in their data. With its simple access and easy use, the software enables different departments to explore data, create reports, and make wise decisions. Integrated well with Microsoft 365, it allows teams to collaborate more freely and deliver live updates.

Microsoft Power BI
Starting Price
₹ 1260.00 excl. GST
Key Features of Power BI
- Connects to virtually any data source for unified reporting
- Generates AI-driven insights with advanced analytics capabilities
- Offers easy-to-use report-building tools and templates
- Supports collaboration through integration with Microsoft 365 apps
- Enables secure, governed data environments through Microsoft Fabric
- Scales from self-service to enterprise-level BI
- Embeds reports directly into customer-facing apps
Pros
- Deep Microsoft 365 integration
- Highly customizable visualizations
Cons
- Complex pricing for large teams
- Some features are limited to higher tiers
Power BI Plans & Pricing:
| Plan | Price |
|---|---|
| Power BI Pro | $14.00/user/month |
| Power BI Premium | $24.00/user/month |
| Power BI in Microsoft Fabric | Variable – Contact Sales |
2. Domo

Domo consolidates data from anywhere and makes it available for the entire organization to view. All users from marketing and sales, finance, IT, and leadership can make use of the tool. It helps teams to discover, study, and use insights on their own.

Domo
Starting Price
Price on Request
Key Features of Domo:
- Connects with a wide range of cloud and on-premises data sources
- Allows users to create dynamic dashboards and visualizations without code
- Brings all business data into one unified view
- Enables self-service analytics for users across departments
- Provides secure access controls to manage data governance
- Offers embedded analytics to extend insights outside the platform
- Includes AI-powered tools for data exploration and predictive insights
- Supports natural language queries for intuitive data interaction
Pros
- Highly customizable and scalable
- Strong AI and automation
Cons
- A little difficult to learn for beginners
- It can be overwhelming for small teams
Domo Plans & Pricing: Pricing is available on request at Techjockey based on business size and requirements.
3. Tableau

Tableau from Salesforce is a top business intelligence tool that lets businesses turn their information into understandable charts and graphs. It helps beginners and experts analyze data, find answers to complex issues, and decide with confidence based on the data. Both in the cloud and on-site, Tableau effectively links teams to foster a strong analytics culture.

Tableau
Starting Price
$ 900.00
Key Features of Tableau:
- Connects to diverse data sources with ease
- Offers drag-and-drop functionality for quick visualizations
- Supports complex data blending across databases
- Allows real-time dashboard sharing and collaboration
- Provides strong governance and IT oversight
- Scales flexibly across teams and infrastructures
- Enables ad hoc analysis and deep exploration
- Supports AI-driven insights and forecasting
Pros
- Easy for Excel users
- Can handle large datasets
- Better collaboration and communication
Cons
- Lacks Advanced Analytics Capabilities
- Need IT support for complex deployments
Tableau Plans & Pricing:
| Plan | Price (per user/month, billed annually) |
|---|---|
| Enterprise Creator | $115.00 |
| Enterprise Explorer | $70.00 |
| Enterprise Viewer | $35.00 |
4. Looker

Looker is a new self-service BI platform designed to assist organizations in achieving the best from their data. Designed to be flexible and user-friendly, Looker makes it easy for both tech-savvy and non-tech users to analyze and visualize data.

Looker
Starting Price
Price on Request
Key Features of Looker:
- LookML lets data teams create centralized, reusable data models.
- Users can build dashboards and reports without writing SQL.
- Visualizations are interactive and allow real-time data exploration.
- Role-based permissions enforce strong data governance.
- Share dashboards and reports easily across teams
- Collaborate through Slack, email, and embed
- Integrate with cloud data warehouses like BigQuery and Snowflake
- Reduce IT dependency through user-friendly self-service access
- Get real-time insights to speed up business decisions
Pros
- Very intuitive for non-technical users
- Centralized, governed data modeling
- Strong data security
Cons
- Requires training for full utilization
- Initial setup can be complex
Looker Plans & Pricing: You need to request a quote for Looker pricing.
5. Zoho Analytics

Zoho Analytics is another self-service BI tool that enables businesses to explore and visualize their data easily. Anyone, technical or a non-technical professional, can benefit from it to get insights and make better decisions from the data extracted. With cloud or on-premise installation available, Zoho can be used by businesses in every industry and at any size.

Zoho Analytics
Starting Price
₹ 1200.00 excl. GST
Key Features of Zoho Analytics:
- Works with more than 250 data sources, including cloud apps, databases, and spreadsheets
- Interactive visualizations with highly customizable charts, graphs, and widgets
- AI-based insights, predictive analytics, and natural language queries
- Easy collaboration with report sharing and threaded discussions
- Mobile business intelligence access through dedicated apps
Pros
- Intuitive drag-and-drop interface
- A single platform for data, insights, and decision-making
- Wide range of integrations
Cons
- Merging multiple datasets into one report can be difficult
- Limited customization for some visual elements
- Performance may lag with massive datasets
Zoho Analytics Plans & Pricing:
| Plan | Price (per month, billed annually) | Users Included |
|---|---|---|
| Basic | ₹960 | 2 users |
| Standard | ₹1,900 | 5 users |
| Premium | ₹4,200 | 15 users |
| Enterprise | ₹15,850 | 50 users |
| Custom | Contact for pricing | Custom users |
6. ThoughtSpot

ThoughtSpot comes with an intuitive, search-based interface. It lets teams ask questions in natural language and get instant insights without depending on IT. Regardless of your business size, ThoughtSpot allows you to act on insights from data more quickly.

ThoughtSpot
Starting Price
$ 25.00
Key Features of ThoughtSpot:
- Users can ask data questions in natural language using a GenAI-powered search interface.
- Interactive Liveboards allow personalized, real-time insights and visualizations.
- Insights can be embedded into business apps for a seamless workflow.
- AI-assisted data modeling helps uncover trends, anomalies, and forecast outcomes.
- Quick connection to multiple cloud data sources like Snowflake, BigQuery, and Redshift.
- Teams can easily collaborate and share insights across the organization.
Pros
- Natural language query experience
- Can connect with various tools
- Offers advanced customization for charts, graphs
Cons
- Cost increases with a high number of queries
- A little difficult to integrate with other tools
ThoughtSpot Plans & Pricing:
| Plan | Users | Pricing |
|---|---|---|
| Essentials | 20 users | $1,250/month |
| Pro | Unlimited | Custom pricing |
| Enterprise | Unlimited | Custom pricing |
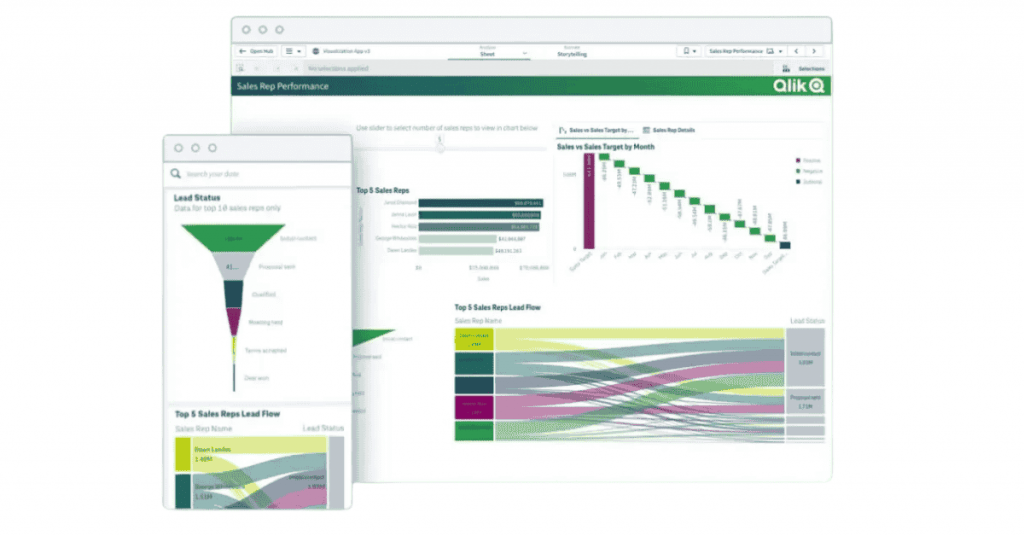
7. Qlik Sense

Qlik Sense enables employees at all levels to create dynamic dashboards and personalized reports. Backed by AI and an associative analytics engine, Qlik Sense helps businesses make smarter, faster decisions by unlocking deep insights from their data.
Key Features of Qlik Sense:
- Drag-and-drop visualizations help reveal hidden insights
- Access analytics anytime, anywhere, on any device
- Use SmartSearch to explore data flexibly
- Collaborate and share insights through data storytelling
- Integrate data from various sources into one platform
- Ensure data protection with simple self-service governance
- Connect to hundreds of databases and cloud services
- Leverage advanced visualizations and guided discovery

Qlik Sense
Starting Price
Price on Request
Pros
- Has a user-friendly interface
- Offers a variety of APIs and connectors
- Broad data source connectivity
Cons
- Quite expensive than other competitors
- Limited data export; lacks full extraction support
Qlik Sense Plans & Pricing:
| Plan | Price (per month) |
|---|---|
| Starter | $200 |
| Standard | $825 |
| Premium | $2,750 |
| Enterprise | Contact for quote |
Conclusion
Businesses using AI-powered analytics see decision accuracy jump by 20–30% on average. It clearly shows how these tools can be helpful for your organization.
Any company, from a startup to a large business, can gain agility, become more productive, and drive its culture with self-service BI software. Determine what your business requires, compare the listed platforms, and invest in the one that aligns with your goals for smarter and faster data analysis.
Mehlika Bathla is a passionate content writer who turns complex tech ideas into simple words. For over 4 years in the tech industry, she has crafted helpful content like technical documentation, user guides, UX content, website content, social media copies, and SEO-driven blogs. She is highly skilled in... Read more


