-

-
Description
-
Pricing
-
Features
-
Specification
-
Review
-
Compare
-
FAQs
-
Alternatives
 Get Free Advice
Get Quote
![]()
Description
Pricing
Features
Specification
Review
Compare
FAQs
Alternatives
Get Free Advice
Get Quote


Brand : StockCharts
![]()
4.1 
3 Ratings
Have Questions?
Starting at $ 20
Save Extra with 2 Offers

Users with registered businesses can purchase goods from merchants on the platform to satisfy their business needs. Users are not permitted to utilize any products acquired through the platform for resale, advertising, business, or further distribution.
For each purchase made, users will receive a Tax Invoice (or 'GST invoice') that includes specific details such as:
the GSTIN of the user associated with their registered business, and
the specified Entity Name for their business.
It should be noted that not all products are eligible for GST Invoice. Only the products displayed by participating sellers with the 'GST-based Invoice Available' callout on the product description page would qualify.
Certain goods and services are not eligible to get a GST Invoice, including items with VAS, i.e., Value Added Services (e.g., Total Mobile Protection/Assured Buyback) and those involving an exchange offer at the time of purchase.
Users must ensure the accuracy of the GSTIN, and business entity name provided for the GST Invoice. Requests for corrections into GST Invoice would not be accommodated by Techjockey.com or any Seller, and any issues arising from user-provided information are the sole responsibility of users.
Techjockey.com is not liable for the GST Invoice or any associated input tax credit. To efficiently claim an input tax credit, users should select the registered place of business address as per the GST authority's data and follow the provisions of the GST Act and rules.
To claim an input tax credit, the delivery and billing addresses must match. Furthermore, input tax credits will not be granted if the delivery address and GSTIN on the invoice are from different states. In case of incorrect GST details provided during the order placement, the order will be canceled automatically.
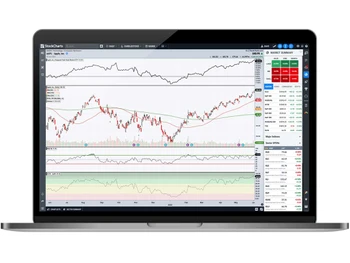
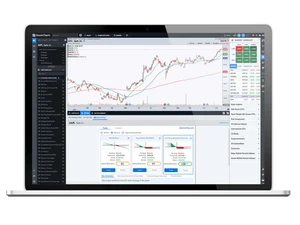
StockCharts is an online charting and analysis platform that helps traders track stock market trends with interactive charts and technical indicators. ...Read more
 Safe & Secure
  Assured Best Price
 We make it happen! Get your hands on the best solution based on your needs.


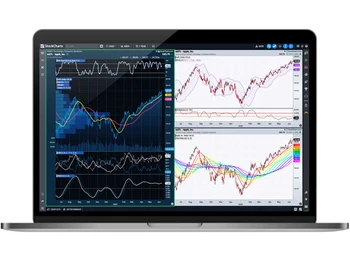
Award-Winning Charting
Provides high-quality, interactive stock charts with multiple indicators.
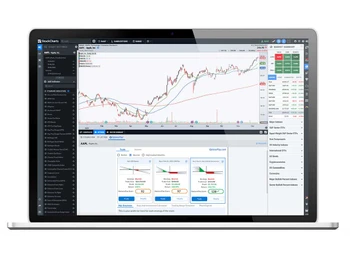
ChartLists
Allows users to organize and save charts for easy access and comparison.
Dashboards
Offers a centralized view of market data, watchlists, and important charts.
Advanced Technical Scans
Helps identify trading opportunities using powerful scanning tools.
Alerts & Notifications
Sends real-time alerts for price movements and technical signals.
Seasonality Charts
Analyzes historical trends to help predict market performance in different seasons.
| Brand Name | StockCharts |
| Information | StockCharts is the web's leading technical analysis and financial charting platform for online retail investors. |
| Founded Year | 1999 |
| Director/Founders | Chip Anderson |
| Company Size | 1-100 Employees |

![]() 20,000+ Software Listed
20,000+ Software Listed
![]() Best Price Guaranteed
Best Price Guaranteed
![]() Free Expert Consultation
Free Expert Consultation
![]() 2M+ Happy Customers
2M+ Happy Customers


![12 Best Open Source Data Visualization Tools [Free & Paid]](https://cdn.techjockey.com/blog/wp-content/uploads/2022/08/01140433/12-Best-Open-Source-Data-Visualization-Tools-Free-Paid-_feature.jpg?d=265x163 "Blog - 12 Best Open Source Data Visualization Tools [Free & Paid]")