USA
USA UAE
UAESmall Business
Designed for startups and growing businesses


See More



Brand: Skillmine Technology Consulting
Unlock actionable insights with AI-powered analytics and dynamic dashboards using DataV, the intuitive no-code platform for confident data-driven decision-making.
See MoreHave you used DataV before?
Share your insights for better experience
Brand: Skillmine Technology Consulting
Founded Year: 2011
At Skillmine, we are a next-gen technology consulting and services company built on a single powerful belief: businesses must continuously EVOLVE to stay relevant, resilient, and future-ready.
Looking for The Right Pricing?
Share your requirements and get a plan built around your business.
Price Available on Request
Get personalised DataV pricing that fits your needs. Our team will connect with you.
 Dashboards Chart Types Geospatial Maps Tabular Reporting KPI Monitoring Drag-and-Drop UI Drill-Down Analytics Natural Language Query (NLQ) Prediction & Forecasting AI Insights Data Correlation Alerts & Reports Role-Based Access Control (RBAC) Self-Service Analytics Universal Calendar & Slicers

Watch the demo video to explore key features, real workflows, and how the software fits your business needs.
 Windows
  MacOS
MacOS  Desktop
  Cloud-Based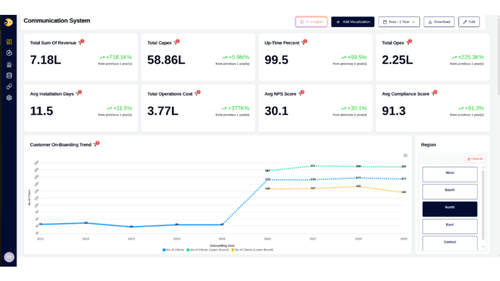
Small Business
Designed for startups and growing businesses
Medium Business
Built for business growth and flexibility
Enterprises
Designed for complex and large-scale business needs
Techjockey Trusted Reviews from Verified Users
No reviews are currently available for DataV. Discover similar Data Analytics Software reviews

Google Analytics
Whats great - I genuinely find Google Analytics indispensable for its versatile functionalities. It simplifies tasks like conversion tracki... read more

Zoho Analytics
Whats great - This is why anonymity is important. It's also why basically every piece of software on their site has stellar feedback. So no... read more

Helium 10
Whats great - Powerful suite if you use its full power; many sellers report they got significant business growth after using Helium 10. read more
DataV
Price On Request
Desktop
Mobile
Web based
On Premises
Windows
Mac OS
Zoho Analytics
₹ 1200
Desktop
Mobile
Web based
On Premises
Windows
Mac OS

Meltwater
Price On Request
Desktop
Mobile
Web based
On Premises
Windows
Mac OS

Insigna
₹ 100000
Desktop
Mobile
Web based
On Premises
Windows
Mac OS

Hex
Price On Request
Desktop
Mobile
Web based
On Premises
Windows
Mac OS

Dimensions AI
Price On Request
Desktop
Mobile
Web based
On Premises
Windows
Mac OS
Digantara Stars
Price On Request
Desktop
Mobile
Web based
On Premises
Windows
Mac OS
Dynatron Software
Price On Request
Desktop
Mobile
Web based
On Premises
Windows
Mac OS
Querri
Price On Request
Desktop
Mobile
Web based
On Premises
Windows
Mac OS
Echo Data Analytics
Price On Request
Desktop
Mobile
Web based
On Premises
Windows
Mac OS

WisdomAI
Price On Request
Desktop
Mobile
Web based
On Premises
Windows
Mac OS
(0) Product(s) selected
Starting Price:
$36 /Month
Available
Price on Request
Available
Price on Request
Available
Price on Request
Starting Price:
$20 /Month
Available
Price on Request
Available
Price on Request

Available
Price on Request

Available
Price on Request

Starting Price:
$7 /Month

Starting Price:
$150 /Machine/Month
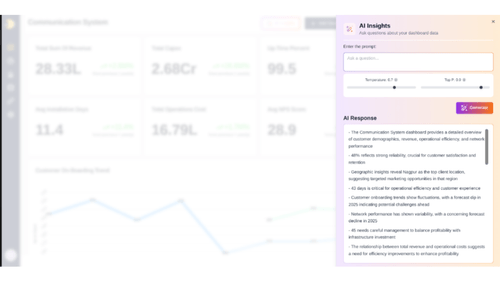
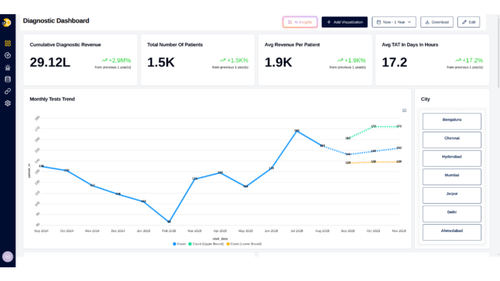
DataV is an advanced analytics and visualization platform designed by Skillmine Technology Consulting. It helps organizations transform raw data into actionable insights through static and dynamic visualizations. The software enables data-driven decision-making by offering powerful data modeling, AI-assisted analytics, and dynamic visualization dashboards. It empowers users to monitor performance, identify trends, and make informed strategic decisions from a single, unified interface, even without an extensive analytics background.
DataV pricing details are available on request on techjockey.com.
DataV is not free. While there is a mention of 0 Trial and a Try For Free option, this typically refers to a trial period rather than a perpetually free version of the full software. The pricing is customized based on business requirements.
DataV is designed for intuitive use, even for individuals without an analytics background. Users can leverage its low-code/no-code interface and drag-and-drop UI to create complete dashboards, visualizations, and reports. It features a Query Builder for adding custom filters and a Natural Language Query (NLQ) capability, allowing users to ask questions in plain English to get instant insights. The platform supports interactive dashboards, drill-down analytics, and a universal calendar to explore data naturally and make data-driven decisions.
DataV is used to transform raw data into actionable insights, facilitating data-driven decision-making across various business functions. Its applications include monitoring business performance, identifying trends, and making informed strategic decisions. It's ideal for business storytelling, operational reporting, validating data, and ensuring compliance. Furthermore, DataV supports planning, budgeting, and operational forecasting through its prediction and forecasting capabilities, helping organizations look forward with confidence.
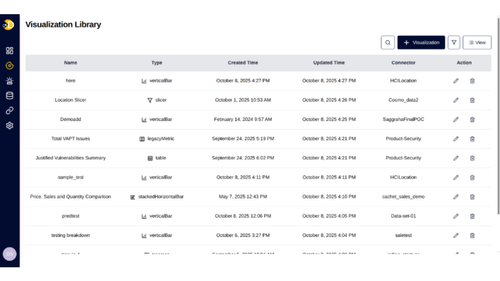
DataV offers a rich collection of over 30 chart types to craft compelling narratives. This includes essential charts for trends and comparisons, advanced analytics visuals for multidimensional data, geospatial maps to visualize location-based data, tabular reporting for granular detail, and KPI cards to highlight critical numbers for instant visibility.
DataV empowers non-technical users through several features, including a low-code/no-code design interface and a drag-and-drop UI for easy dashboard customization. Its Natural Language Query (NLQ) allows users to ask questions in plain English and receive instant insights without needing SQL or technical scripts. Additionally, an intuitive Query Builder enables users to refine insights with custom filters directly within visualizations, making analytics accessible to everyone.
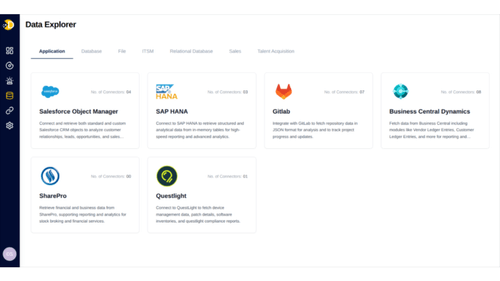
Yes, DataV supports Data Correlation & Multi-Source Blending, allowing users to unify and compare data across various departments like Sales, HR, Finance, Operations, and Manufacturing. This feature helps break data silos, detect hidden relationships and patterns automatically, and turn fragmented datasets into a single, insight-rich truth layer.
Yes, DataV includes Prediction & Forecasting features. It provides AI-powered time series forecasting, intelligent trend extension, and scenario modeling. These capabilities come with confidence intervals that highlight potential risks and opportunities, making DataV an ideal tool for planning, budgeting, and operational forecasting.
DataV includes robust features for security and reporting. It offers Role-Based Access Control (RBAC) to manage user permissions and ensure data security. The platform also provides Alerts & Reports, allowing users to stay informed about critical data changes and distribute insights effectively. Interactive Dashboards further enhance reporting by providing dynamic and engaging data experiences.
DataV is ideal for business executives, decision-makers, business analysts, sales teams, marketing teams, finance professionals, operations managers, and organizations that need data visualization, reporting, and business intelligence for informed decision-making.
DataV is an advanced analytics and visualization platform from Skillmine Technology Consulting designed to help organizations transform raw data into actionable insights through powerful data modeling and dynamic visualization dashboards.
DataV is used to enable data-driven decision-making by creating interactive dashboards and reports that help businesses monitor performance, identify trends, and make informed strategic decisions from a single interface.
You can use DataV's low-code/no-code interface with a drag-and-drop UI to build dashboards, or ask questions in plain English using its Natural Language Query feature to get instant insights.
DataV price is available on request at Techjockey.com.
Yes, DataV features a Natural Language Query (NLQ) tool that allows you to ask questions in plain English to get accurate, instant insights without needing SQL or technical scripts.
Yes, DataV supports multi-source data blending, allowing you to unify and compare data from different departments like Sales, HR, and Finance to discover hidden relationships.
DataV offers over 30 chart types, including essential charts, advanced analytics visuals, geospatial maps for location data, tabular reports, and high-impact KPI cards.
Yes, DataV provides AI-powered time series forecasting and prediction features to help with planning, budgeting, and operational forecasting by modeling future trends.
Yes, DataV dashboards are interactive and support features like drill-down analytics, allowing you to move from a high-level summary to granular detail with a single click.
20,000+ Software Listed
Best Price Guranteed
Free Expert Consultation
2M+ Happy Customers
Terms and Condtions

Users with registered businesses can purchase goods from merchants on the platform to satisfy their business needs. Users are not permitted to utilize any products acquired through the platform for resale, advertising, business, or further distribution.
For each purchase made, users will receive a Tax Invoice (or 'GST invoice') that includes specific details such as:
the GSTIN of the user associated with their registered business, and
the specified Entity Name for their business.
It should be noted that not all products are eligible for GST Invoice. Only the products displayed by participating sellers with the 'GST-based Invoice Available' callout on the product description page would qualify.
Certain goods and services are not eligible to get a GST Invoice, including items with VAS, i.e., Value Added Services (e.g., Total Mobile Protection/Assured Buyback) and those involving an exchange offer at the time of purchase.
Users must ensure the accuracy of the GSTIN, and business entity name provided for the GST Invoice. Requests for corrections into GST Invoice would not be accommodated by Techjockey.com or any Seller, and any issues arising from user-provided information are the sole responsibility of users.
Techjockey.com is not liable for the GST Invoice or any associated input tax credit. To efficiently claim an input tax credit, users should select the registered place of business address as per the GST authority's data and follow the provisions of the GST Act and rules.
To claim an input tax credit, the delivery and billing addresses must match. Furthermore, input tax credits will not be granted if the delivery address and GSTIN on the invoice are from different states. In case of incorrect GST details provided during the order placement, the order will be canceled automatically.