![]()
Description
Pricing
Features
Specification
Review
Compare
FAQs
Alternatives
 Get Free Advice
Get Quote


Brand : Anchorage Technologies
![]()
4.4 
5 Ratings & 1 Review
Have Questions?
Starting at
₹ 299
Save Extra with 2 Offers

Users with registered businesses can purchase goods from merchants on the platform to satisfy their business needs. Users are not permitted to utilize any products acquired through the platform for resale, advertising, business, or further distribution.
For each purchase made, users will receive a Tax Invoice (or 'GST invoice') that includes specific details such as:
the GSTIN of the user associated with their registered business, and
the specified Entity Name for their business.
It should be noted that not all products are eligible for GST Invoice. Only the products displayed by participating sellers with the 'GST-based Invoice Available' callout on the product description page would qualify.
Certain goods and services are not eligible to get a GST Invoice, including items with VAS, i.e., Value Added Services (e.g., Total Mobile Protection/Assured Buyback) and those involving an exchange offer at the time of purchase.
Users must ensure the accuracy of the GSTIN, and business entity name provided for the GST Invoice. Requests for corrections into GST Invoice would not be accommodated by Techjockey.com or any Seller, and any issues arising from user-provided information are the sole responsibility of users.
Techjockey.com is not liable for the GST Invoice or any associated input tax credit. To efficiently claim an input tax credit, users should select the registered place of business address as per the GST authority's data and follow the provisions of the GST Act and rules.
To claim an input tax credit, the delivery and billing addresses must match. Furthermore, input tax credits will not be granted if the delivery address and GSTIN on the invoice are from different states. In case of incorrect GST details provided during the order placement, the order will be canceled automatically.
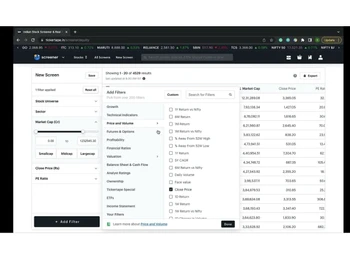
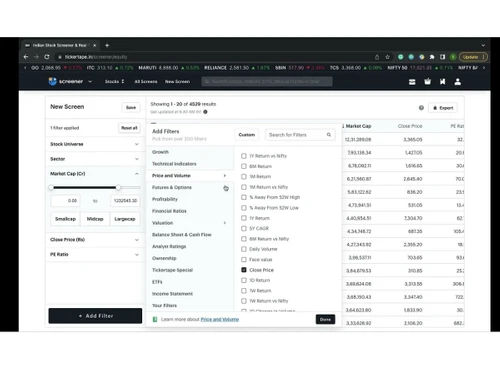
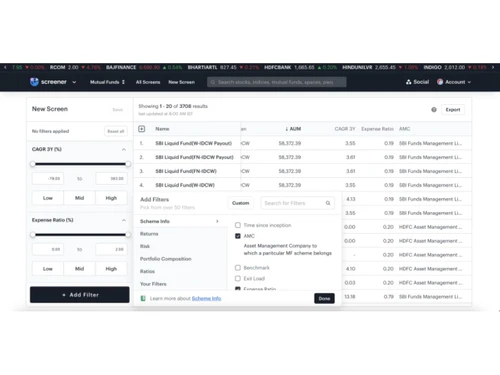
A stock market software designed to help investors research, analyze, and track stocks, mutual funds, ETFs, and market indices, primarily in the Indian market. ...Read more
 Safe & Secure
  Assured Best Price
 We make it happen! Get your hands on the best solution based on your needs.

Core Features
Order Execution
Research and Analysis
Technical Analysis
Fundamental Analysis
Backtesting and Optimization
Risk Management
Trading Options
Reporting & Analytics
Account Management
Integrations
Alerts & Notifications
Have recommended this product
Overall Score
Review this product
Your valuable feedback helps others like you make a better decision.

“Ticker Tape US Stocks Review | Ticker Tape Review | Ticker Tape Screener”
4.4
Review by: Wealth Dekho
| Brand Name | Anchorage Technologies |
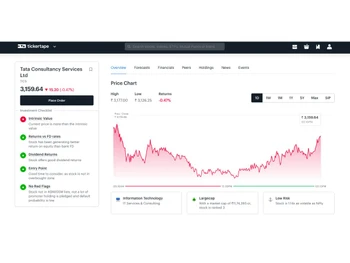
| Information | Tickertape provides data, information & content for Indian stocks, Mutual Funds, ETFs & indices |
| Founded Year | 2021 |
| Director/Founders | Anugrah Shrivastava, Vasanth Kamath, Rohan Gupta, and Ujjwal Ankur |
| Company Size | 101-500 Employees |

Top Selling Products
![]() 20,000+ Software Listed
20,000+ Software Listed
![]() Best Price Guaranteed
Best Price Guaranteed
![]() Free Expert Consultation
Free Expert Consultation
![]() 2M+ Happy Customers
2M+ Happy Customers


 4.6
4.6 


