linkedin
  • Become a Seller

Best Dashboard Software in 2024

What is Dashboard Software?

Dashboard software are those business intelligence tools that help companies in data analyzing and monitoring purposes. Once deployed, these systems provide critical information that helps in generating deeper insights and the latest trends and organizational KPIs. Read Buyer’s Guideimg

Top 5 Dashboard Software in 2024

  • top product arrowClickup
  • top product arrowTableau
  • top product arrowHubSpot Dashboard Software
  • top product arrowShyplite
  • top product arrowDashboardFox

Best Dashboard Software

(Showing 1 - 10 of 14 products)

Most PopularNewest FirstTop Rated Products
Clickup

Clickup

Brand: ClickUp

4.6img

4.6 out of 5

(7 user reviews)

ClickUp is one of the best productivity management software for organizations. It enables organizations to manage their daily task efficiently. The task... Read More About Clickup img

$10

Tableau

Tableau

Brand: Tableau Software

Be the first to review

Tableau Softwareis a complete Data Visualization Tools designed to serve Startups, SMBs, SMEs and Agencies. This Data Visualization Tools for has a simple... Read More About Tableau img

Price On Request

HubSpot Dashboard Software

HubSpot Dashboard Software

Brand: HubSpot

4.5img

4.5 out of 5

(0 user reviews)

HubSpot Dashboard is a dashboard and reporting software that offers powerful analytics for everyone.... Read More About HubSpot Dashboard Software read review arrow

$890 /Month

Shyplite

Shyplite

Brand: Shyplite

4.3img

4.3 out of 5

(0 user reviews)

Shyplite is a robust logistics technology platform that offers a unified, multi-carrier integrated service to the e-commerce sector.... Read More About Shyplite read review arrow

₹21 /Quantity

DashboardFox

DashboardFox

Brand: 5000fish

4.4img

4.4 out of 5

(0 user reviews)

DashboardFox is a cost-effective BI platform used to create real-time dashboards and reports without subscription hassles.... Read More About DashboardFox read review arrow

$395 /Quantity

Dashboard Software Product List Top Banner - 1
Dashboard Software Product List Top Banner - 2
Style Scope

Style Scope

Brand: InetSoft Technology

4.5img

4.5 out of 5

(0 user reviews)

Style Scope is a visualization dashboard that combines data mashup and visualization design in a web app.... Read More About Style Scope read review arrow

$165 /Month

DashThis

DashThis

Brand: Moment Zero

4.6img

4.6 out of 5

(0 user reviews)

DashThis Dashboard Software will streamline data visualization and reporting with user-friendly dashboards that drive informed decisions.... Read More About DashThis read review arrow

$45 /month

iDashboards

iDashboards

Brand: iDashboards

4.4img

4.4 out of 5

(0 user reviews)

iDashboard will streamline your data with its intuitive interface for insightful analytics and informed decision-making.... Read More About iDashboards read review arrow

$833 /month

Geckoboard

Geckoboard

Brand: Geckoboard

Be the first to review

Geckoboardis a complete Dashboard Software designed to serve Startups, SMBs, SMEs and Agencies. This Dashboard Software for has a simple interface and is e... Read More About Geckoboard img

Price On Request

Metabase

Metabase

Brand: Metabase

4.3img

4.3 out of 5

(0 user reviews)

... Read More About Metabase img

$85

Last Updated on : 10 Apr, 2024

ask your question about software

Got any questions?

Ask Question from Real Users
or Software Experts

img
img

We provide the best software solution for your business needs

Founded in 2016, Techjockey is an online marketplace for IT Solutions. We are a pioneer in this field, as we are taking IT solutions to SMBs & MSMEs in tier II & tier III cities and enabling digitization of day-to-day processes.

2 Million+

Happy Customers

500+

Categories

20,000+

Software listed

Best Dashboard Software FAQ’s

Software questions,
answered

Conditional formatting in paid and free dashboard software solutions is applied to dashboards on regular intervals. These are done for highlighting:  variances hidden patterns trends These are then applied to charts of all types attached to a dashboard. You can also use conditional formatting to add trend indicators and secondary axis.

Icon library in dashboard creation tools is used for adding dynamic images and text boxes to a dashboard. These are mostly done for doing data visualizations to identify the current business trends. The feature comes handy for monitoring the social media as well as undertaking campaign and marketing automation. 

Paid and free dashboard tools are trusted for helping companies make accurate data based decisions. These are essential for managing the performance of projects, large and small. Let’s have a look at some of the paid and free dashboard tools for doing data visualization: Target Dashboard  Datapine Scoro Tableau InetSoft Bilbeo SimpleKPI Smartsheet

The most reliable dashboard tools offer various collaborative tools for document sharing and managing user access. Besides providing an easy option for publishing on the web, it also has in- built query analyser. Using the best digital dashboard software, you can be assured of receiving automated performance reports and alerts.

Paid and free dashboard tools support critical key metrics for generating customizable and shareable KPI reports. There are available for preparing detailed KPI reports custom formulas and intelligent alarms. You can set up user access here for clients, partners and external team’s, based very much on your preferences.

Dashboard Software Reviews

C

Clickup

5

“Easy drag and drop feature as once the task is completed you can move it to the next stage which helps you to keep track on your task accomplished and pending work y...”

- Arpit Gupta

See all Clickup reviewsimg
C

Clickup

4.6

“I love the design and the usability of the software and I am really looking forward to using this product.”

- Nikita Pandey

See all Clickup reviewsimg
C

Clickup

4.2

“I especially love the way you can customize the look and feel of your projects and boards. I have recommended ClickUp to many of my colleagues and friends.”

- Siddharth Narayana

See all Clickup reviewsimg
C

Clickup

4.3

“Clickup has a clean interface and it is very easy to use. I am able to organize all my projects and tasks in one place and get a clear overview of what I have to do.”

- Rahul Devrani

See all Clickup reviewsimg
C

Clickup

5

“Amazing project management software that allows you to link tasks with GitHub integration.”

- Aaron

See all Clickup reviewsimg

Dashboard Software Price List In India

Dashboard Software Cost
Top Dashboard Software Starting Price Rating
Clickup$10.00 4.6
HubSpot Dashboard Software$890.00 /Month4.5
Shyplite₹21.00 /Quantity4.3
DashboardFox$395.00 /Quantity4.4
Style Scope$165.00 /Month4.5
DashThis$45.00 /month4.6
iDashboards$833.00 /month4.4
Metabase$85.00 4.3

Buyer's Guide for Top Dashboard Software

Found our list of Dashboard Software helpful? We’re here to help you make the right choice and automate your business processes. Let’s discover some of the essential factors that you must consider to make a smarter decision!

  • What is a Dashboard Software?
  • What Are the Different Types of Dashboard Creation Tools?
  • Live Interactive Dashboards with Business Dashboard Software
  • Open Source and Paid Dashboard Tools- Use Cases
  • Features& Functionalities of Dashboard Software
  • Evaluation Criteria for Choosing the Right Dashboard Software
  • Benefits of Using Paid & Open Source Dashboard Tools

What is a Dashboard Software?

Business dashboard software are trusted for their abilities to provide companies with metrics and indices for measuring the performance of their business. Based on all objectives and set targets, you can use dashboard creation tools for identifying gaps in performance on hourly, daily, or even weekly basis.

The advantage of using dashboard reporting tools is that it gives you the freedom to customize it based on your choice. As the dashboard gets customized, you can use it for project reporting as well as managing timesheets, workflow and resources. Paid and open source dashboard software are flexible, intuitive, and robust tools that let you plan projects as well as schedule tasks with ease.

What Are the Different Types of Dashboard Creation Tools?

  • Operational dashboards: This type of dashboard is used for monitoring frequently changing business processes. Updates here are very frequent and many individuals use the operational dashboards on an hourly basis for tracking progress towards achieving a target. Such dashboards are best designed for identifying performing key metrics and indices.

  • Strategic dashboards: Strategic dashboards are monitoring tools used for tracking the progress of KPIs. Compared to an operational dashboard, updates in a strategic dashboard are less frequent.  The data visualizations here are simple too and such dashboards are usually accessed only once in a day.

  • Analytical dashboards: Analytical dashboards support the analysis of large data volumes for investigating trends. These are also used for gaining business insights and predicting the outcome of decisions. Data updates here aren't very frequent and you will find such support features as ad-hoc queries, drill-down, etc.

Live Interactive Dashboards with Business Dashboard Software

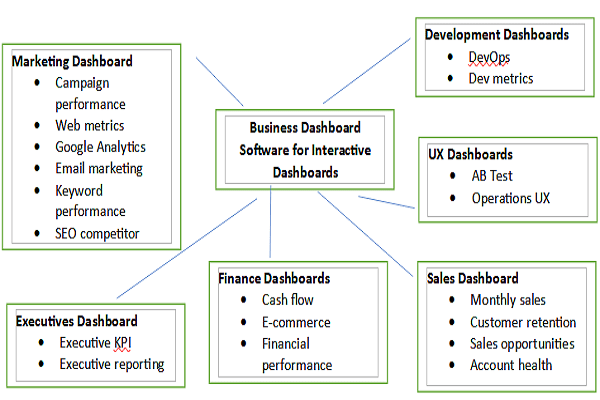
The best paid and open source dashboard software lets you create dashboards department or service-wise. Examples enumerated in the graphic organizer below would make this further clearer. 

Digital Dashboard Software Flow Chart For How To Work

Open Source and Paid Dashboard Tools- Use Cases

  • Data analysts who require scalable visualizations
  • SaaS vendors look for white label solutions
  • Enterprises handling multiple data sources need it
  • SMBs also require a customer-facing dashboard to seek growth opportunities
  • Companies prefer HIPAA compliance
  • E-commerce businesses lookout for web analytics solutions 
  • Sales professionals search for it for sales or lead generation
  • Healthcare professionals need it for managing their practice
  • BPOs try to assess the performance of their executives

Features& Functionalities of Dashboard Software

  • Predefined templates: Predefined templates help in speeding up the entire dashboard-creating process. Prebuilt templates are important for doing fast data visualizations so that interactive dashboards can be created instantly. You can even edit such dashboards later on, using the edit dashboard feature.

  • Unified style: In-built with dashboard creation tools, this enables you to apply unified changes in your data charts. These are usually in the form of charts, texts, etc., that can be applied in the form of graphs and data labels. The unified style setting option comes in handy for implementing data analytics as well as effortlessly changing the theme of a dashboard.

  • Chart tooltips: Charts are considered essential for doing data visualizations. Dashboard analytics tools support tool-tips for drawing custom charts so that the same can be attached to the dashboard with ease. You can even use these tool-tips for adjusting the information available within these charts.

  • Comparison period: Comparison period is an advanced feature that comes in-built into the digital dashboard software solutions. The module is specifically used for comparing the data of two different time periods to reach the right conclusion.

  • Custom fields: A custom field in the dashboard creation tools is used for creating a single calculated field so that several such fields can be combined into a merged field. These dashboard tools also offer a drag and drop interface for developing such custom fields.

  • Hierarchy filters: Hierarchy filters within dashboard tools are designed to help end-users access data of a specific time period. You can even set up constraint values like equal to and less than for flexibly navigating through old data.

  • Power viewer: Business dashboard software's power viewer feature has been designed keeping in view such users that have to collaborate with multiple managers/ departments or big teams.

  • Time interval widgets: Different graphs and charts in a dashboard can have their timescale enhanced using the time interval widget. Also, available is this drill-down functionality for assessing key performing indicators.

Evaluation Criteria for Choosing the Right Dashboard Software

  • User interface: Clean and navigable interface so that both beginners and professionals can access it with ease.
  • Support material: It is important to ensure that there is guidance available in the form of video tutorials, tech, and user support.
  • Data updates: You need to make sure that there is an option available for exporting the data just as there needs to be an additional module available for accessing all the real-time data. 
  • Customization: The interface needs to be customizable so that you can select the appearance of your dashboard at your convenience.
  • Interactive charts & graphs: Interactive graphs/charts in the dashboard analytics tool make the data visualization process worth providing insights.
  • Integrations: Integrations help connect the dashboard with other tools. Therefore, the integration support is an important requirement.
  • Pricing: Well this is important because a digital dashboard software needs to fit your budget.

Benefits of Using Paid & Open Source Dashboard Tools

  • Key values help save time: Key values are already built-in within both paid and open source dashboard software. These help with analyzing and coding all information. This saves you from the hassle of doing all coding yourself or making lengthy reports.
  • Drag/drop capability for easy visualization: Drag and drop capability let you create visualized dashboards in a few simple clicks. This not only allows easy data visualization, but also helps in generating dashboard reports.
  • Scheduling dashboard publications: You can easily prepare schedules using the best dashboard analytics tools. Once such a schedule is in place, you can automate the entire dashboard publication process from a single user to a group.
  • Custom alerts for tracking KPIs: Key performing indicators of a business need to be regularly tracked. For accessing such KPIs easy and quick, digital dashboard software solutions let you set up custom alerts for every trigger. As soon as there is a new report, you can be assured of receiving immediate notifications.
  • Team-based data views: Popular dashboard tools make it easy for every user to view only data that is relevant to them. Therefore, a team-based data view module makes it possible to only add such data as relevant to a user on the dashboard.
  • Real-time updates: Dashboard software solutions let you receive immediate alerts in case there is any change made to the data in a dashboard. This feature is especially useful for identifying fluctuations in business metrics and indices.

Still got Questions on your mind?

Get answered by real users or software experts

20,000+ Software Listed 20,000+ Software Listed

Best Price Guaranteed Best Price Guaranteed

Free Expert Consultation Free Expert Consultation

2M+ Happy Customers 2M+ Happy Customers