What is a Gantt Chart Software?
Gantt not only shows start and end dates but also displays dependencies, scheduling, and deadlines, such as how much of the task is completed at a particular stage or who is the task owner. Hence, you can keep tasks on track when you have a large team and multiple stakeholders are involved with varying scopes.
Gantt chart tools are best suitable for over viewing the on-going or completed tasks in visual form. In other words, charts created using Gantt chart apps are amazing project management tools for two reasons. One, illustrating any project's schedule becomes easier. Second, a clear picture of dependency between on-going activities and the status of the progress is achieved.
As a project or task moves forward, such charts help in highlight updated project schedules along with a quick status update to every stakeholder having access to these charts. All these activities are done within the timeframes set by end users to let you picture the project's progress against this timeframe.
Resource Workload & Gantt Chart Creators
Gantt chart apps are great tools for checking resource workloads. They help with not just cutting down expenses for more efficient resource management but also improve the team's efficiency and performance. The software use following modules for managing the resource workload:
- Identifying those that may be underperforming or have too many tasks at hand. As these get identified by Gantt chart apps, you can reallocate the tasks accordingly.
- Adjusting together the working days, off-days and leaves as per the business calendar.
- Board view for every new task. These are available as small cards in the project schedule section.
- Comment, notes and files can be attached to every task for better team collaboration.
- Immediate notifications in real-time for changes made in Gantt charts.
- Critical path and auto scheduling for automatically adjusting changes in timeline or tasks.
- URLs for exporting and sharing files in format of your choice.
- Time logs for assessing the amount of time spent on a project.
Features of Gantt Chart Software
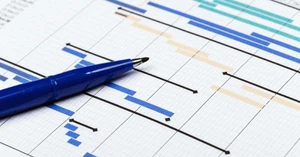
Timeline bar charts represent information for different tasks in the form of symbols and Gantt bars. Timeline bar charts are mostly used for highlighting progress made, schedules and relationships.
Gantt bars are used to represent tasks graphically to highlight different aspects such as the total duration. These bars are suitable for showcasing scenarios like percentage of task completed, actual and planned start days of projects, slack time, etc.
Milestone features within Gantt chart tools are usually in the form of special symbols that are generated at times when a stipulated task gets completed. You have a choice to select from a range of symbols to set as your milestone icon.
- Task dependencies & logistics
Online Gantt chart makers are used for keeping track of the logistics of big and small projects. You can even create task dependencies using Gantt chart apps that ensure all tasks are happening in a certain order. Also, there are coloured lines available to differentiate between tasks in progress and those awaited.
Gantt chart creator is deployed for organizing tasks and their schedules in a better way. As you group these tasks with Gantt chart tools, you find an option for attaching assignee, single or group, to every task being scheduled.
Gantt chart software indicates a project's progress using either bar shading or the percentage symbol. The feature comes handy for teams managing multiple projects across multiple departments.
- Portfolio reports & views
The best Gantt chart software solutions offer portfolio reports and views for identifying tasks that may be lagging behind. A single click option is there for a quick view for these reports.
A user friendly list and calendar format is there for task viewing and scheduling in a better way. Hence, you can view project schedules in a format of your choice, calendar or a list quickly with this feature.
Baseline reports generated by Gantt chart makers are used for comparing planned timelines with the actual ones. The feature also works well for viewing the status of a project in real-time.
Online Gantt Chart Software vs Desktop Gantt Chart Tools
| Online Gantt Chart Software | Desktop Gantt Chart Tools |
| Gantt charts created using online Gantt chart software can be shared easily with multiple users | Gantt charts prepared using the desktop version can only be shared with those who have access to that particular Gantt chart maker’s license |
| Available for multiple users | Single user license only |
| Cost-efficient and reasonably priced | Expensive and high pricing as other software installations may be required |
| Can be used by single as well as a group of users | Most suited for single managers or individual use |
| Leads towards greater productivity due to less cost and more features for better team collaboration | Productivity with desktop Gantt chart apps may not be high |
Project Planning & Visualization- Gantt Chart Tools
Today, Gantt chart apps are deployed across multiple departments for managing both, the resources and the workload. Online Gantt chart makers are thus used extensively for planning multiple projects with multiple teams. Let us have a look at how Gantt chart tools have been helping teams with project planning and management.
Here, Gantt chart software is used for breaking down the construction schedule into a group of different tasks. To each task is attached a specific milestone for monitoring the project's progress and identifying any delays.
Gantt chart software offers software developers an agile approach for all their projects. The platform is also used for deployment and sprint planning.
Event planning generally involves many tasks, all at once. Gantt chart creator helps in grouping various tasks together so that you can set dependencies for each of them.
With Gantt chart tools, you can prepare chart timelines for all kinds of web designing projects. The software is most used here for organizing and structuring the workflows.
Marketing teams use online Gantt chart makers for assessing the opportunities available for marketing communications. These tools are also used for determining the effectiveness of marketing campaigns as well as defining the budgetary requirements.
Benefits Offered By Online Gantt Chart Makers
- Getting an overview of projects
Gantt chart software solutions serve as a great prioritization tool for getting a complete overview of ongoing projects. You get all the details including the duration of tasks, different sub-groups created for organizing tasks, progress achieved, and task dependencies.
- Better team communication & cohesion
You don't need a separate tool for communicating with the team members. Popular Gantt chart apps offer built-in communication tools using which you can track tasks, assess the progress made, add comments and notes to communicate important facts, information and feedback with all the teammates.
- Efficient resource management
The expert Gantt chart creators help with efficient management and utilization of resources. Once the purpose is made available, assigning all Gantt charts, a project timeline that is best for delegating tasks and assigning resources is estimated. This ensures all tasks are completed on time within their assigned budget.
- Checking overlapping activities
Best free Gantt chart software or the paid ones, both help end-users to make sure that there is no task overlap, especially when the project is a bit complex. Therefore all tasks, which may depend on each other can be scheduled in a manner that they don't overlap and get completed right on time.
- More clarity and time management
As you get to view, track and assess every aspect of a project with support from Gantt charts software solutions, you are bound to get better clarity in terms of progress achieved, the budget required, and collaboration done. You can use the software for allocating time to every project and find out any time delays.
- Simple drag & drop functionality
The drag and drop functionality within Gantt chart apps serves multiple purposes. Some of these are changing the task's colors adding schedules/new assignees, recording times, and changing start/end dates of projects. The feature is very simple to use and available right there on the top in a Gantt chart.
Gantt Chart Creator- An effective Tool for Professionals
Professionals from several fields use the software for planning, scheduling, and visualizing tasks. Most of these solutions are easy to use and once you are sure of your deliverables, deploying and using the software is a breeze. Online Gantt chart makers are mostly used by professionals like:
- General managers
- Project leads
- Team manager
- Operations manager
- Marketing managers
- CEOs and heads of organizations, and
- Any professional planning on getting a project timeline
The software is used for the various benefits it offers. However, the very important factors that make it so preferable are:
- Improved team efficiency
- Less time spent on project planning
- Reduction in expenses


